

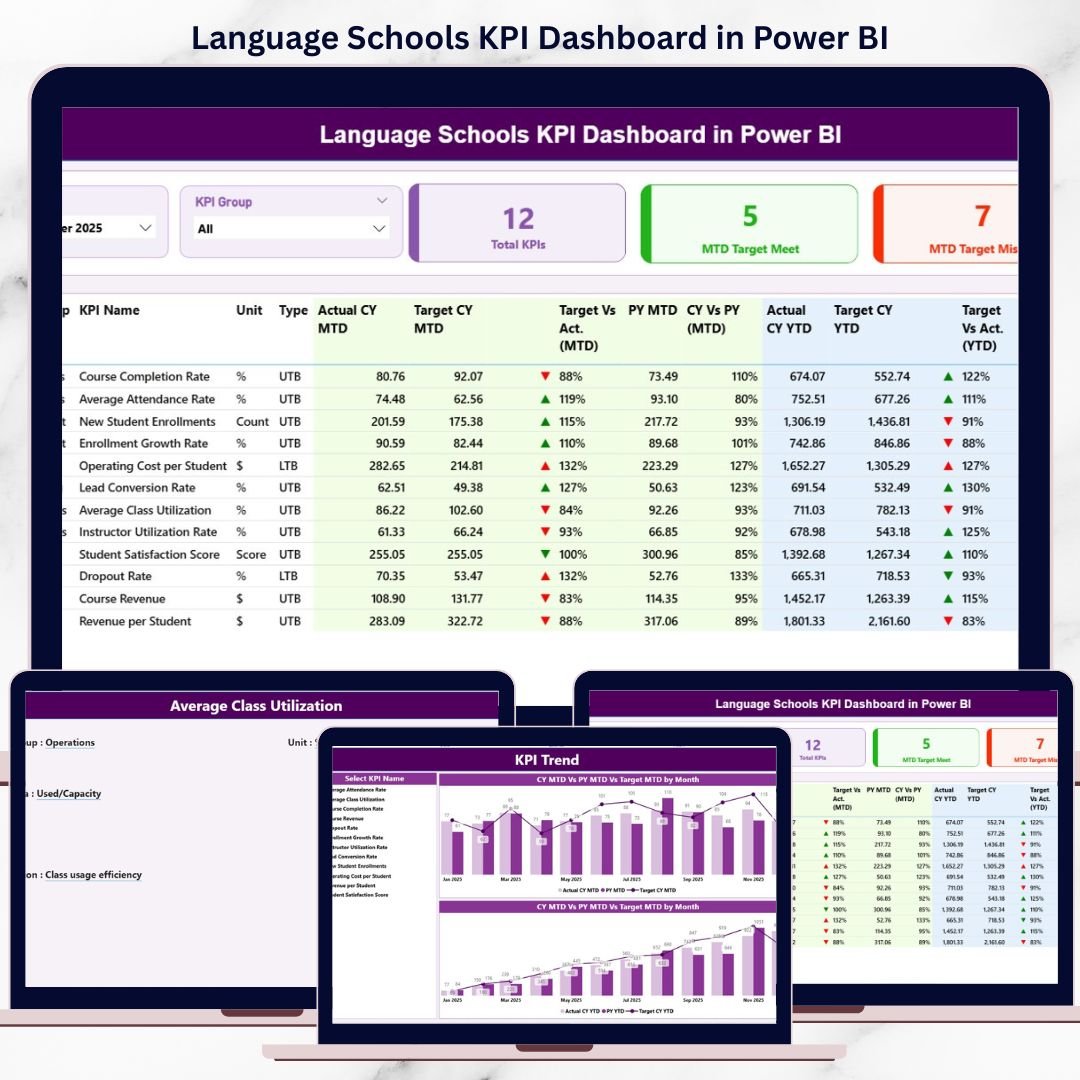

Managing a language school today requires real-time visibility into academics, operations, and financial performance. However, when data remains scattered across Excel files and manual reports, leadership teams struggle to identify issues early. As a result, decisions become reactive instead of strategic.
That is exactly why the Language Schools KPI Dashboard in Power BI becomes a game-changing performance management solution.
This ready-to-use Power BI dashboard transforms structured Excel data into interactive KPIs, performance indicators, and trend analysis. Instead of reviewing static reports, school owners, academic heads, and administrators gain live insights into MTD and YTD performance, target achievement, and year-over-year progress.
Whether you manage a single language institute or a multi-branch education group, this dashboard gives you clarity, control, and confidence—powered by Microsoft Power BI.
🚀 Key Features of Language Schools KPI Dashboard in Power BI
📊 Centralized KPI Monitoring – All academic, operational & financial KPIs in one report
📅 Month & KPI Group Slicers – Analyze performance dynamically
📈 MTD & YTD Tracking – Short-term execution and long-term trends
🎯 Target vs Actual Analysis – Instantly identify performance gaps
📉 Previous Year Comparison – Measure real growth and decline
🔼🔽 Visual Status Icons – Green ▲ / Red ▼ indicators for fast decisions
🧠 Drill-Through Capability – Understand KPI logic and definition
🔄 Excel-Based Data Input – Simple updates, automatic refresh
📦 What’s Inside the Language Schools KPI Dashboard in Power BI
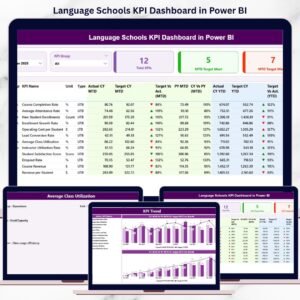
This dashboard includes 3 well-designed analytical pages, each built for clarity and decision-making.
🔹 Summary Page – Performance at a Glance
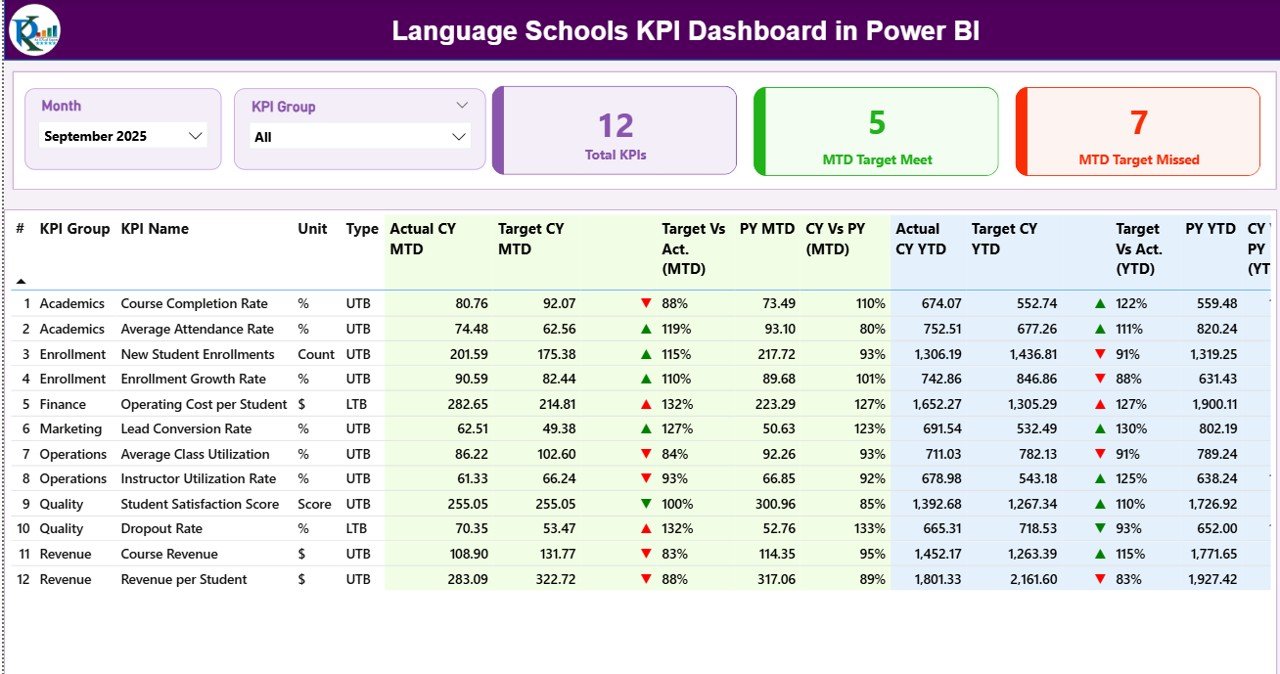
The Summary Page is the command center of the dashboard.
Top Slicers
Month slicer
KPI Group slicer (Academic, Operational, Financial)
KPI Cards
Total KPIs Count
MTD Target Meet Count
MTD Target Missed Count
These cards instantly show overall performance health.
Detailed KPI Table
KPI Number
KPI Group
KPI Name
Unit
Type (UTB / LTB)
MTD Performance
Actual CY MTD
Target CY MTD
▲ / ▼ Status Icon
Target vs Actual (MTD)
PY MTD
CY vs PY (MTD)
YTD Performance
Actual CY YTD
Target CY YTD
▲ / ▼ Status Icon
Target vs Actual (YTD)
PY YTD
CY vs PY (YTD)
As a result, management identifies both monthly issues and long-term trends instantly.
🔹 KPI Trend Page – Deep KPI Analysis
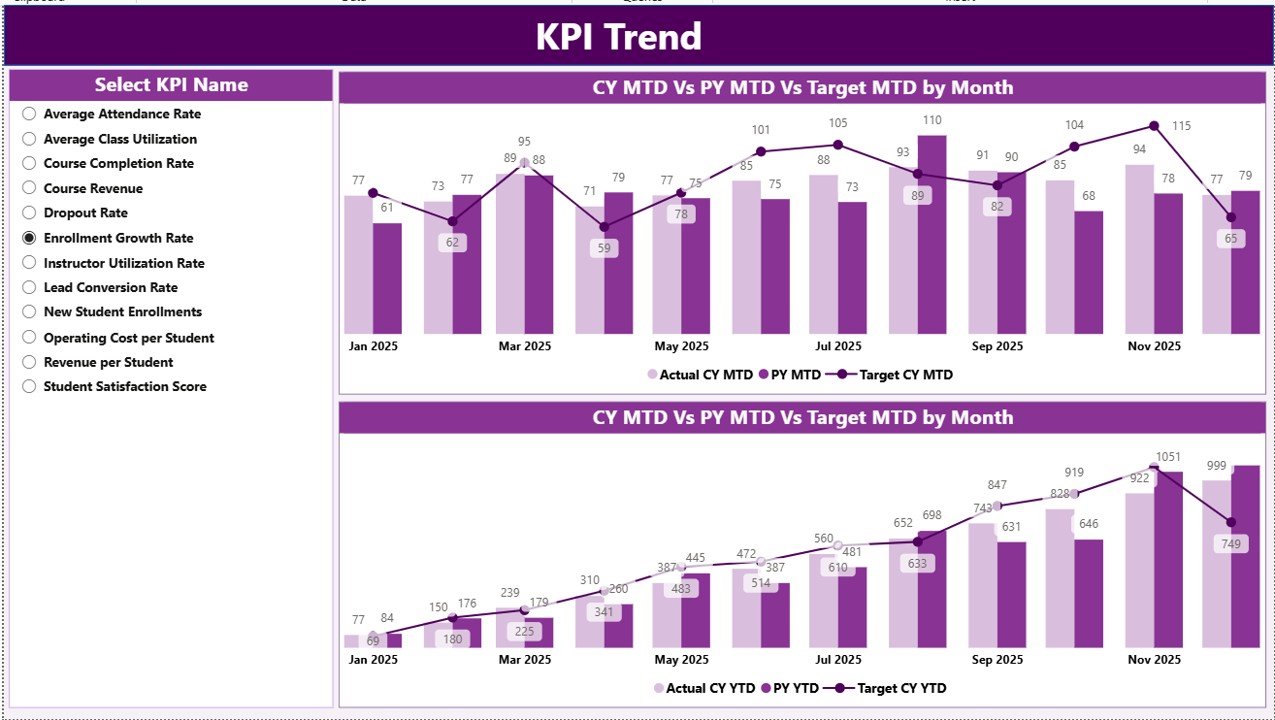
The KPI Trend Page focuses on performance movement over time.
Key highlights:
KPI Name slicer for focused analysis
MTD Trend Combo Chart
Actual
Target
Previous Year
YTD Trend Combo Chart
Actual
Target
Previous Year
This page helps leadership understand patterns, seasonality, and improvement areas clearly.
🔹 KPI Definition Page – KPI Transparency
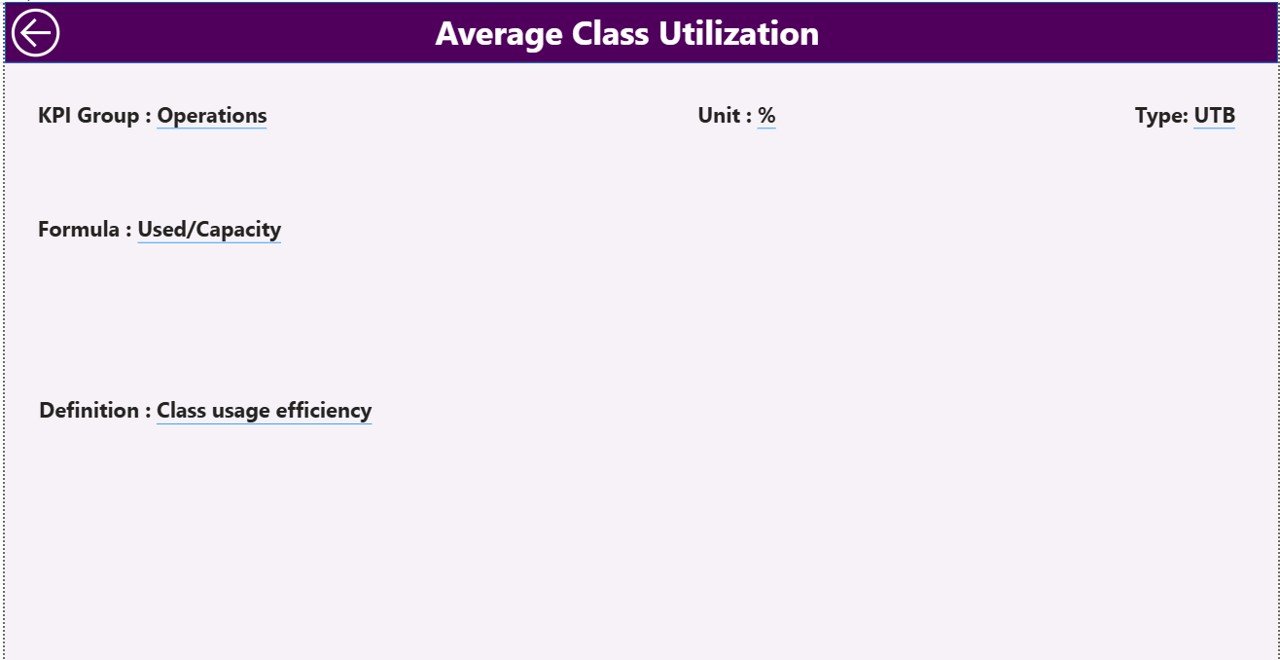
The KPI Definition Page is a drill-through reference page.
It displays:
KPI Formula
KPI Definition
KPI Type (UTB / LTB)
A back button ensures smooth navigation. Therefore, all stakeholders understand what each KPI means and how it is calculated.
🧠 How the Excel Data Source Works
This Power BI dashboard uses a structured Excel file as its data source.
Input_Actual Sheet
KPI Name
Month (first date of month)
MTD Actual
YTD Actual
Input_Target Sheet
KPI Name
Month
MTD Target
YTD Target
KPI Definition Sheet
KPI Number
KPI Group
KPI Name
Unit
Formula
Definition
Type (UTB / LTB)
You only update Excel—Power BI handles everything else.
🎯 Advantages of Language Schools KPI Dashboard in Power BI
✔ Centralized KPI reporting
✔ Faster and smarter decisions
✔ Visual target tracking
✔ Reduced manual reporting effort
✔ Improved transparency and accountability
✔ Scalable for growing institutions
✔ Professional reporting for leadership meetings
👥 Who Can Benefit from This Dashboard?
🎓 Language School Owners
📘 Academic Directors
🧑🏫 Operations Managers
💰 Finance Teams
📊 Education Consultants
### 👉 Click here to read the Detailed Blog Post
🎥 Visit our YouTube channel to learn step-by-step video tutorials
https://www.youtube.com/@PKAnExcelExpert
Watch the step-by-step video tutorial:
Compatibility and Requirements
- Open the report in Power BI Desktop, which is free. Microsoft explains how to install it in Get Power BI Desktop.
- The data lives in an Excel file with Input_Actual, Input_Target and KPI Definition sheets, so you also need Excel or another app that edits .xlsx files to update the numbers.
Frequently Asked Questions
Which pages are in the Language Schools KPI Dashboard?
Three: the Summary Page, the KPI Trend Page and the KPI Definition Page. The KPI Definition Page is a drill-through page with a back button.
What can I filter on the Summary Page?
Month and KPI Group (Academic, Operational and Financial). The cards show Total KPIs Count, MTD Target Meet Count and MTD Target Missed Count.
How do I add this month’s numbers?
Enter the KPI name, month (first date of the month), MTD Actual and YTD Actual in Input_Actual, and the targets in Input_Target. Power BI picks them up on refresh.
Can I see each KPI’s trend?
Yes. On the KPI Trend Page, pick a KPI name to see MTD and YTD combo charts of actual, target and previous year values.
Related Language School Templates
- Language Schools KPI Dashboard in Excel: the same KPIs in Excel.
- Language Schools Dashboard in Power BI: an operations dashboard for language schools.
- Language Schools Dashboard in Google Sheets: for teams that work in Google Sheets.
- Education KPI Dashboard in Power BI: general education KPIs in Power BI.
- Education & School Management Bundle: 8 Excel and Google Sheets school templates.
Browse all Power BI KPI dashboards or the Power BI dashboards.








Reviews
There are no reviews yet.