
🏢 Office Relocation Dashboard in Excel
Relocating an office is a complex, multi-stage process that requires careful planning, precise tracking, and effective communication. From managing budgets to monitoring departmental progress and keeping deadlines in check, a successful move demands complete visibility and control.
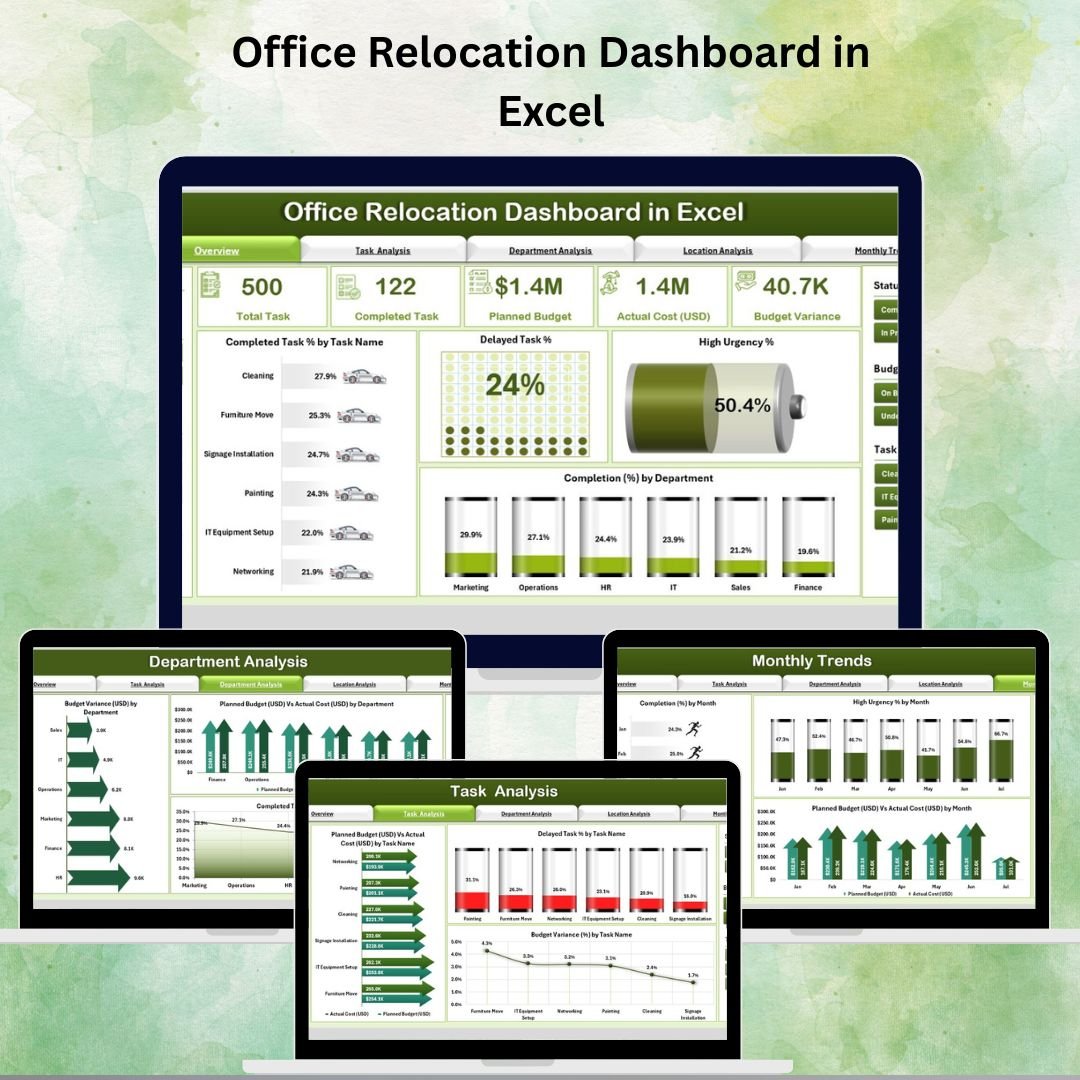
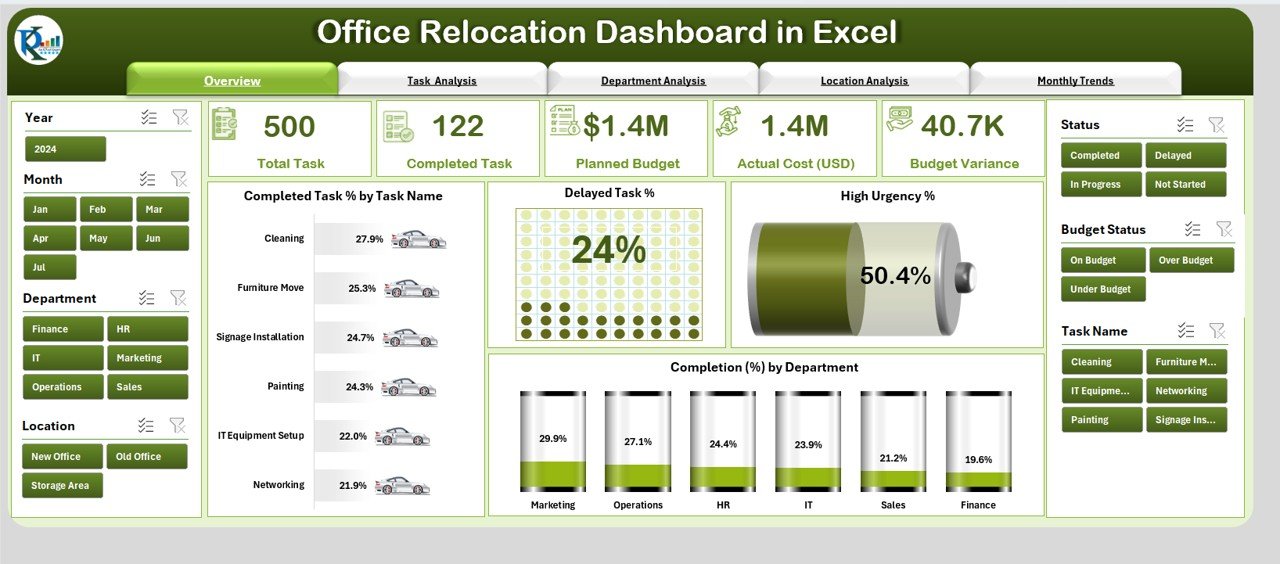
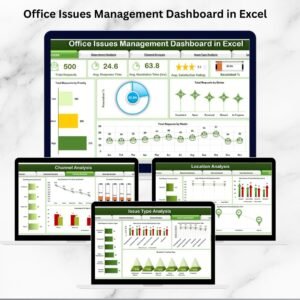
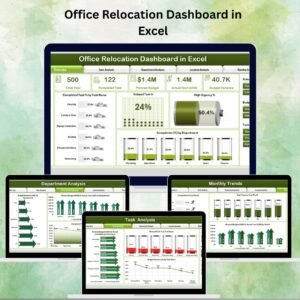
The Office Relocation Dashboard in Excel is a ready-to-use, interactive template designed to centralize all relocation data in one place. With built-in navigation, real-time updates, and easy-to-read visualizations, it enables project managers, facility teams, and executives to stay informed and in control throughout the relocation process.
✨ Key Features of the Office Relocation Dashboard
✅ Five Analytical Pages – Overview, Task Analysis, Department Analysis, Location Analysis, and Monthly Trends.
✅ Page Navigator – Instantly switch between different analytical views without scrolling through large datasets.
✅ Dynamic Slicers – Filter data by department, location, task type, time period, and more.
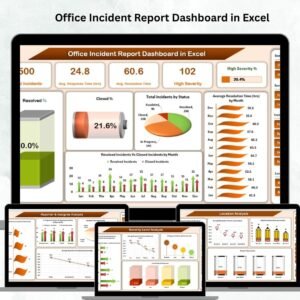
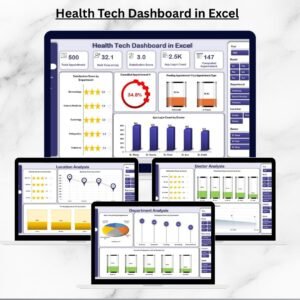
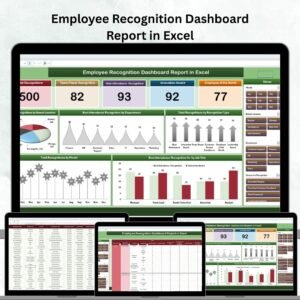
✅ KPI Cards – View essential project metrics like Completion %, Delayed Tasks %, High Urgency %, and Budget Variance at a glance.
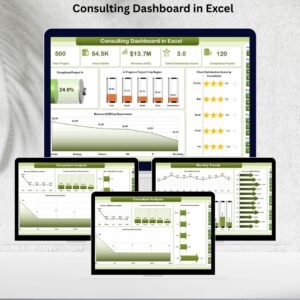
✅ Visual Performance Tracking – Combination of bar charts, column charts, and variance analysis visuals.
✅ Budget vs Actual Comparison – Monitor spending by task, department, and location to avoid overspending.
✅ Data & Support Sheets – Easy to update with dropdown lists to maintain accuracy.
📂 What’s Inside the Office Relocation Dashboard
-
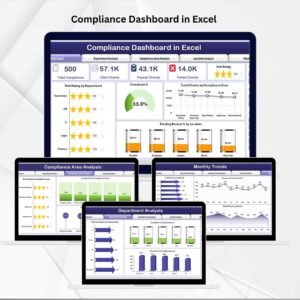
Overview Page – A high-level snapshot with KPI cards and charts showing Completed Task %, Delayed Task %, High Urgency %, and Departmental Completion %.
-
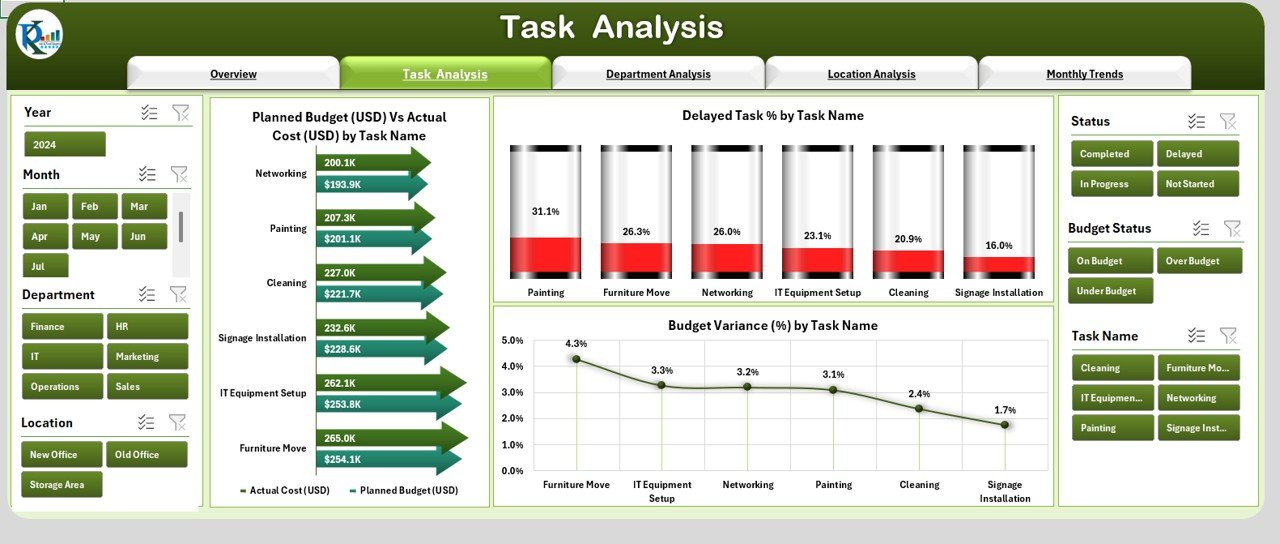
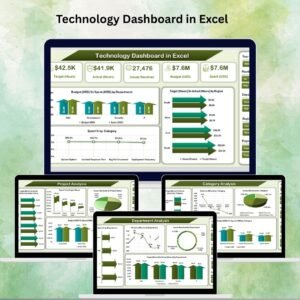
Task Analysis – Compare planned budget vs actual costs, track budget variance %, and monitor delays by individual task.
-
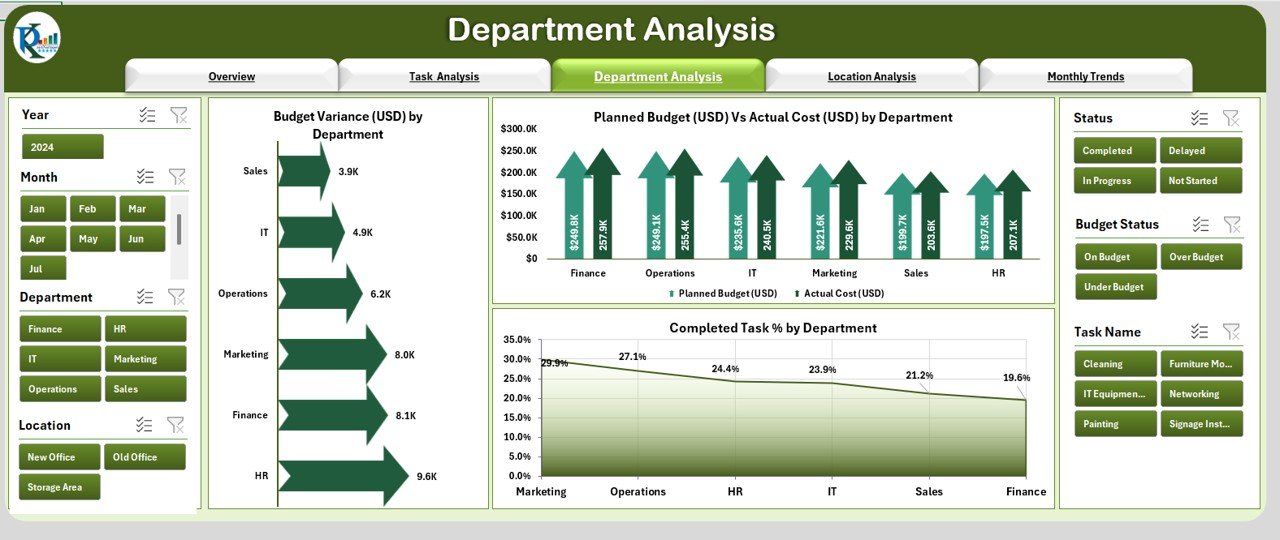
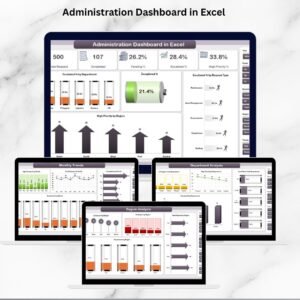
Department Analysis – Review departmental performance with metrics like budget variance, planned vs actual costs, and task completion rates.
-
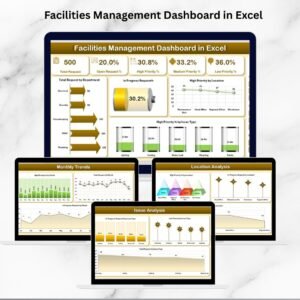
Location Analysis – Perfect for multi-site relocations, comparing completion % and budget variance across locations.
-
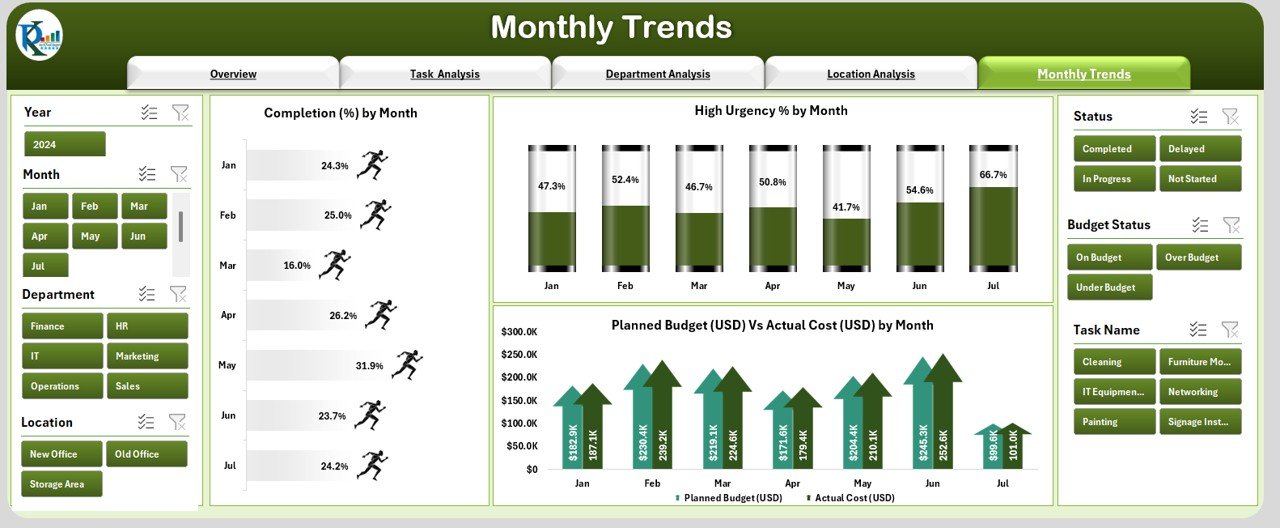
Monthly Trends – Visualize relocation progress, urgency levels, and budget performance over time.
-
Data Sheet – Central repository for all relocation data, including tasks, budgets, departments, and timelines.
-
Support Sheet – Holds reference lists and dropdown values for consistent reporting.
🛠 How to Use the Office Relocation Dashboard
-
Enter Project Data – Add your relocation details to the Data Sheet:
-
Task names
-
Departments
-
Locations
-
Start & end dates
-
Planned & actual budgets
-
Completion status
-
-
Use the Navigator – Switch between pages to focus on specific aspects like tasks, departments, or monthly trends.
-
Filter for Insights – Apply slicers to focus on problem areas or specific timeframes.
-
Monitor KPIs – Keep track of delays, urgent issues, and budget variance in real time.
-
Take Action – Use insights to reassign resources, adjust timelines, or reallocate budgets.
🎯 Who Can Benefit from This Dashboard
🏗 Project Managers – Oversee progress, timelines, and budget control.
🏢 Facility Managers – Coordinate multi-department and multi-location moves.
💰 Finance Teams – Monitor budget adherence and spending patterns.
📈 Executives – Access a clear, visual overview for strategic decision-making.
🚀 Why This Dashboard is a Must-Have
-
Centralized Management – Keep all relocation data in one organized file.
-
Real-Time Updates – Automatically refresh visuals when data changes.
-
Improved Budget Control – Quickly identify and address overspending.
-
Better Communication – Share insights with stakeholders easily.
-
Scalable – Works for single-site or multi-location office relocations.


Reviews
There are no reviews yet.