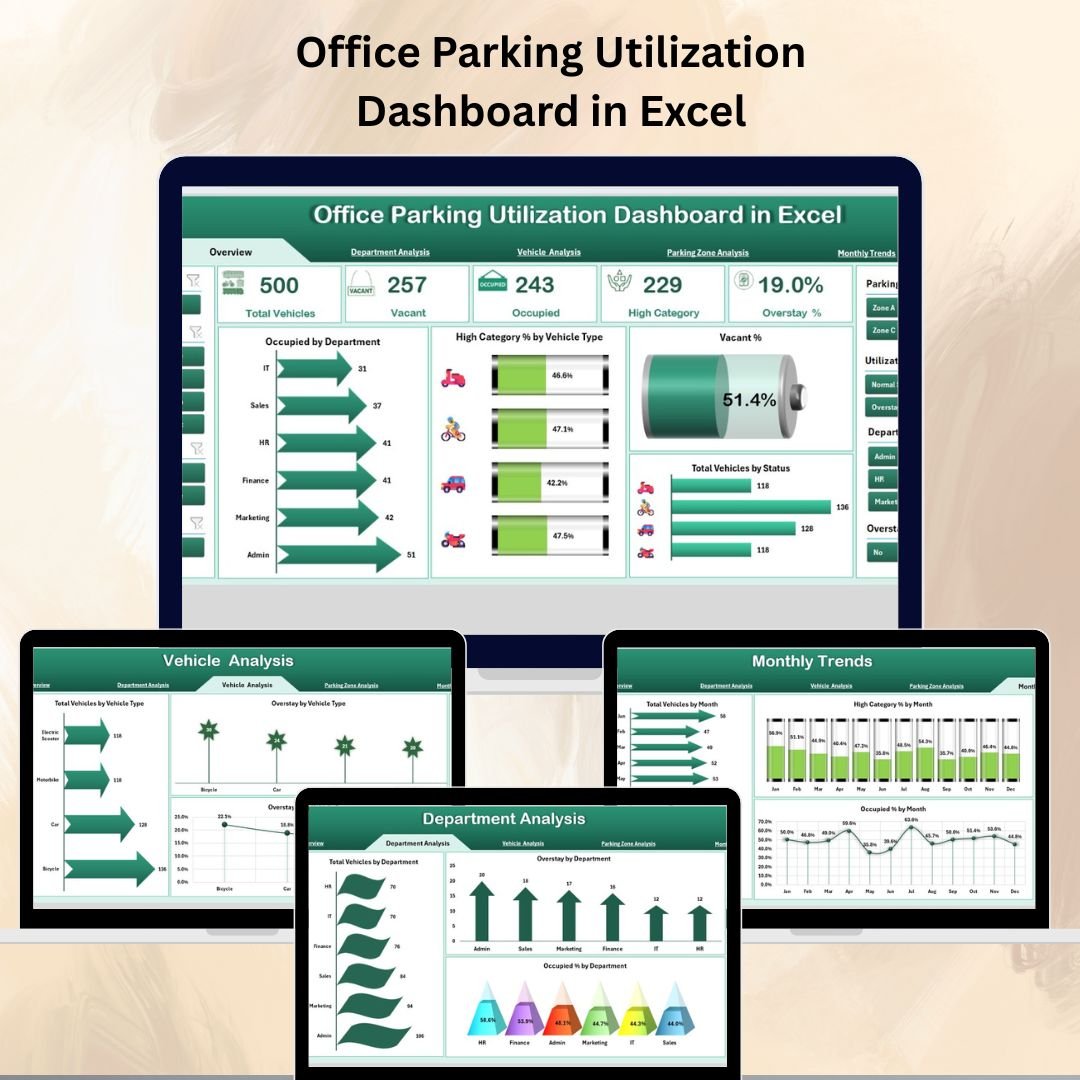
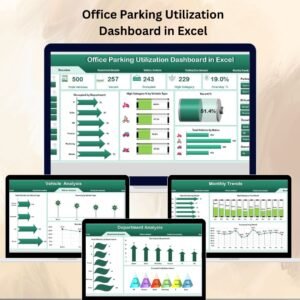
In the modern corporate environment, efficient space management is key to reducing costs and improving operations — and parking is no exception. Unused spaces waste resources, while overcrowded lots frustrate employees and visitors. The Office Parking Utilization Dashboard in Excel is a ready-to-use, data-driven tool designed to help facility managers monitor, analyze, and optimize parking space usage for maximum efficiency.
With detailed insights into occupancy rates, departmental usage, vehicle types, parking zones, and monthly patterns, this dashboard equips you with the intelligence you need to make informed parking management decisions.
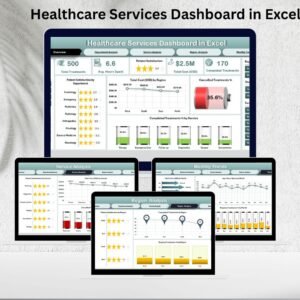
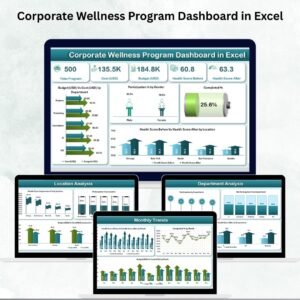
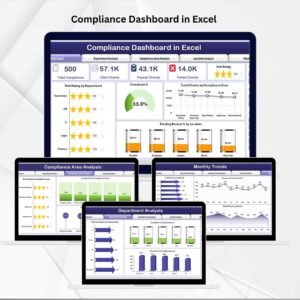
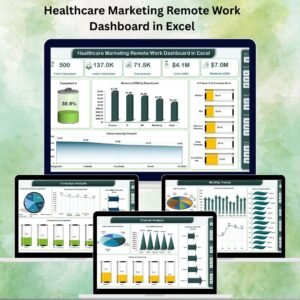
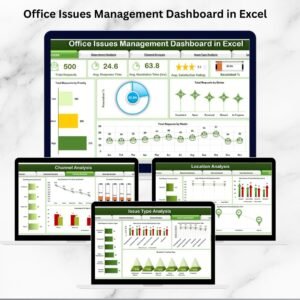
✨ Key Features of the Office Parking Utilization Dashboard
✅ Five Analytical Pages – Overview, Department Analysis, Vehicle Analysis, Parking Zone Analysis, and Monthly Trends.
✅ Interactive Navigation – Quick-access Page Navigator on the left side for smooth switching between sections.
✅ Dynamic Slicers – Filter data instantly by department, vehicle type, parking zone, or time period.
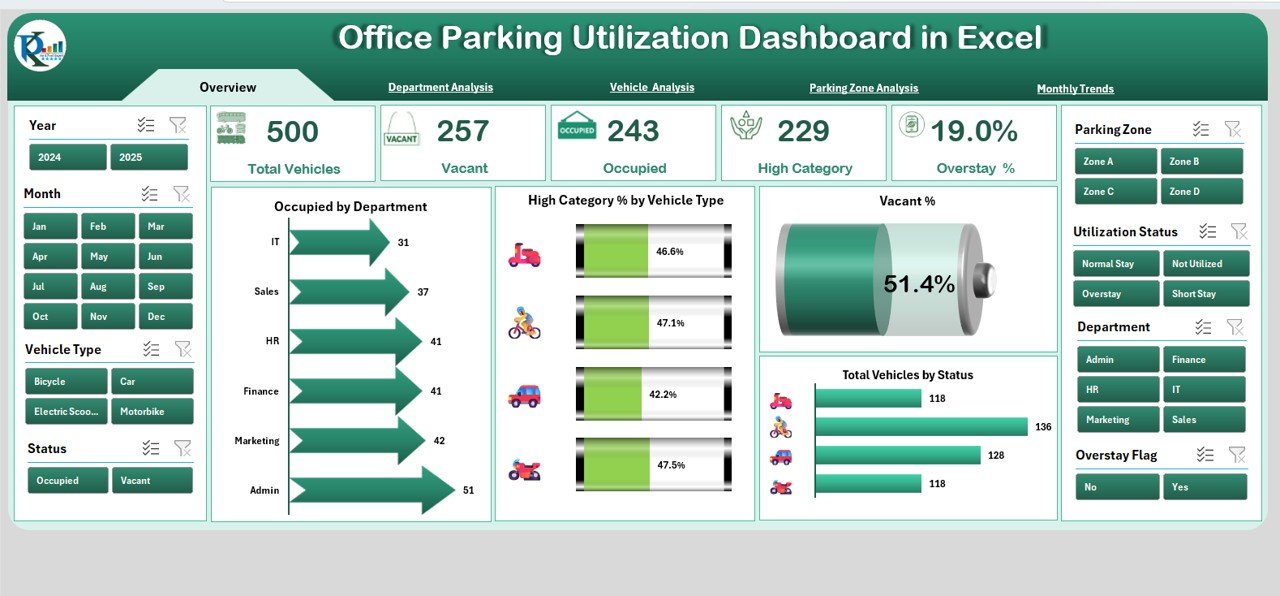
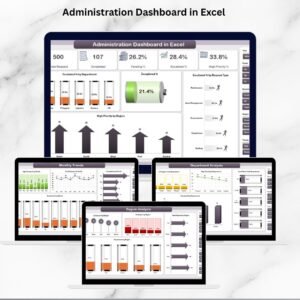
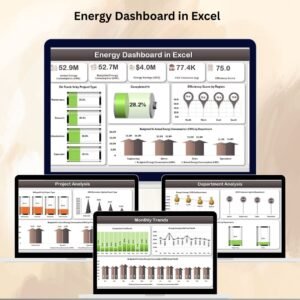
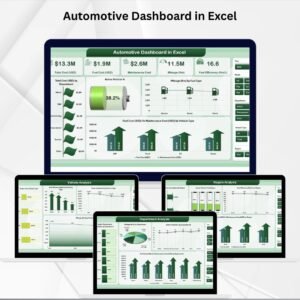
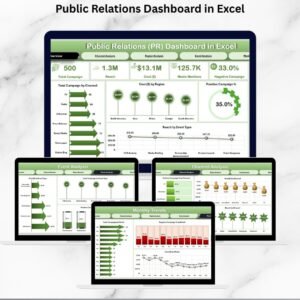
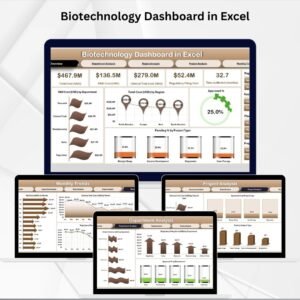
✅ KPI Cards for Fast Insights – See Occupied by Department, High Category % by Vehicle Type, Vacant %, and Total Vehicles by Status at a glance.
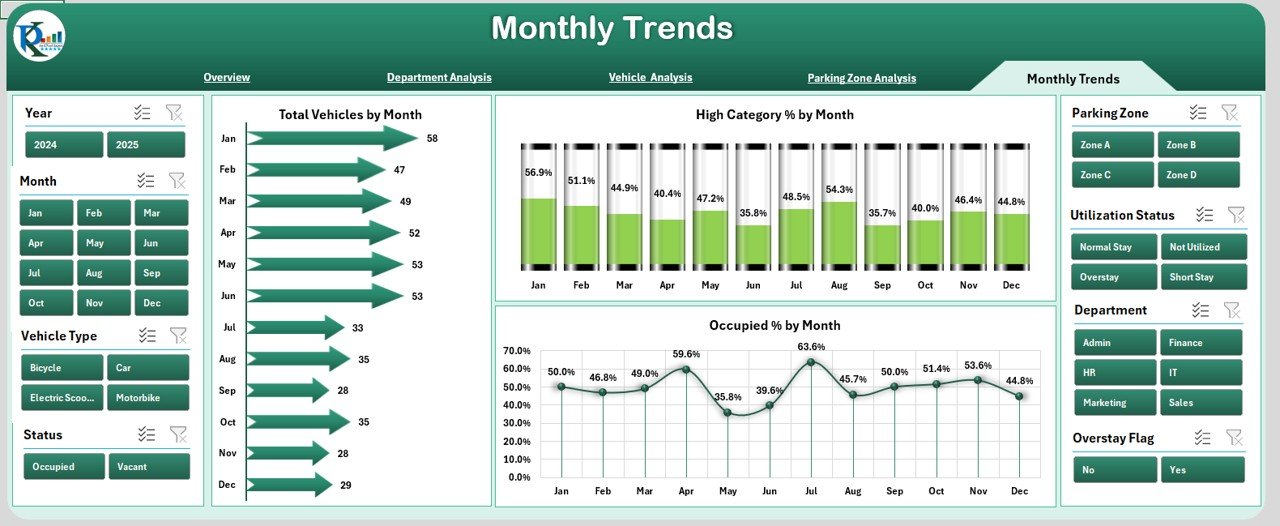
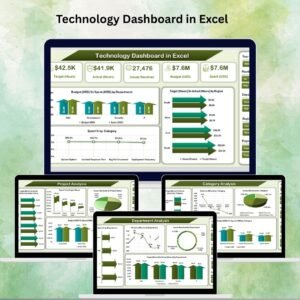
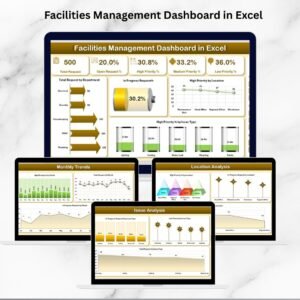
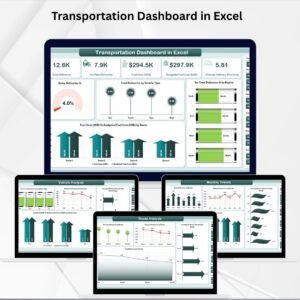
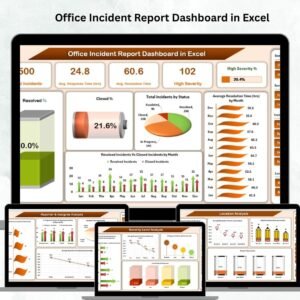
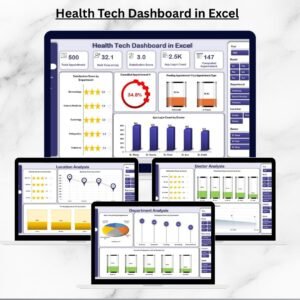
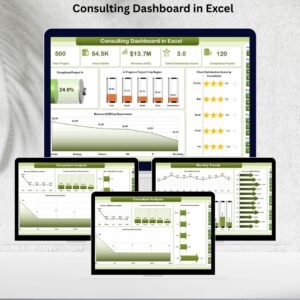
✅ Visual Analytics – Combination of bar charts, donut charts, gauges, and column charts for clear storytelling.
✅ Comprehensive Data Management – Dedicated Data Sheet and Support Sheet for easy updates and accuracy.
✅ Fully Customizable – Adapt to your parking layout, categories, and organizational needs.
📂 What’s Inside the Office Parking Utilization Dashboard
-
Overview Page – The main dashboard view with KPIs and visuals for quick performance snapshots.
-
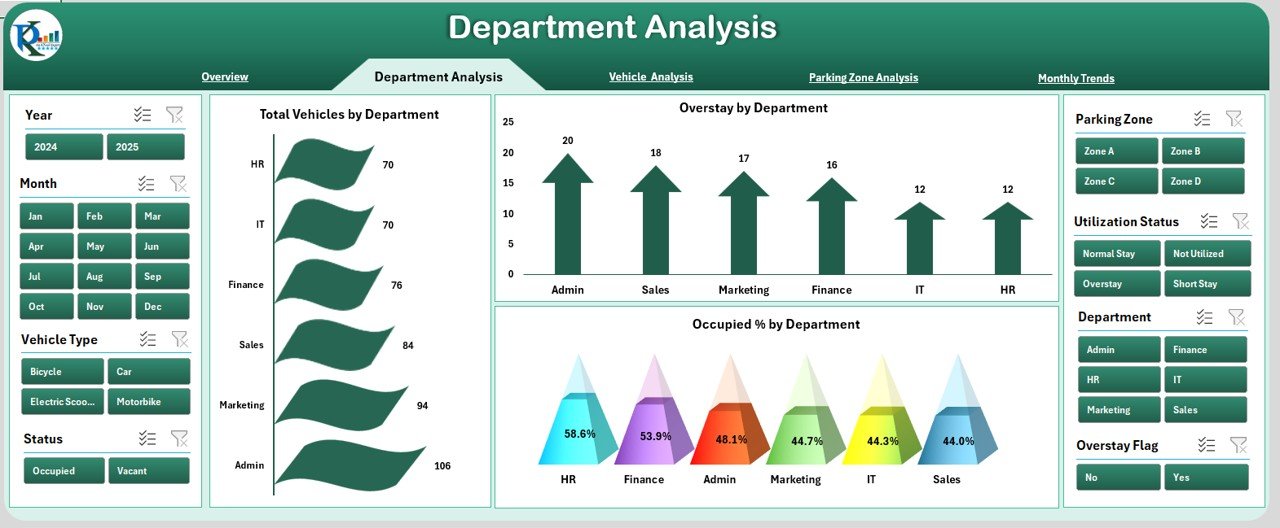
Department Analysis – Focuses on which departments use the most parking, overstay patterns, and occupancy percentages.
-
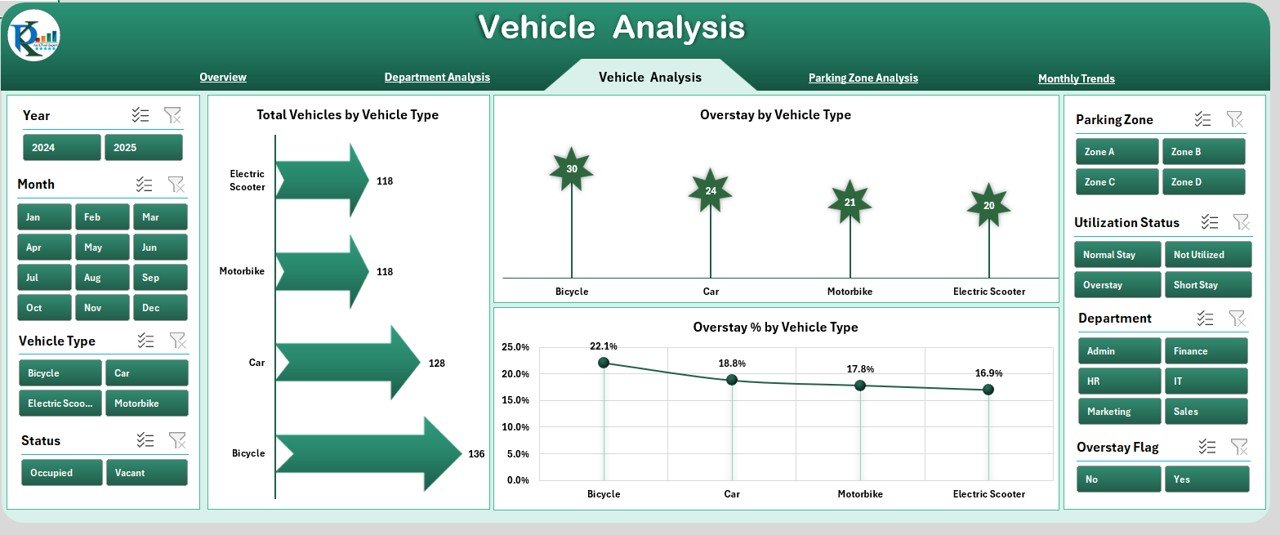
Vehicle Analysis – Breaks down parking usage by vehicle type, helping manage space allocation for different categories.
-
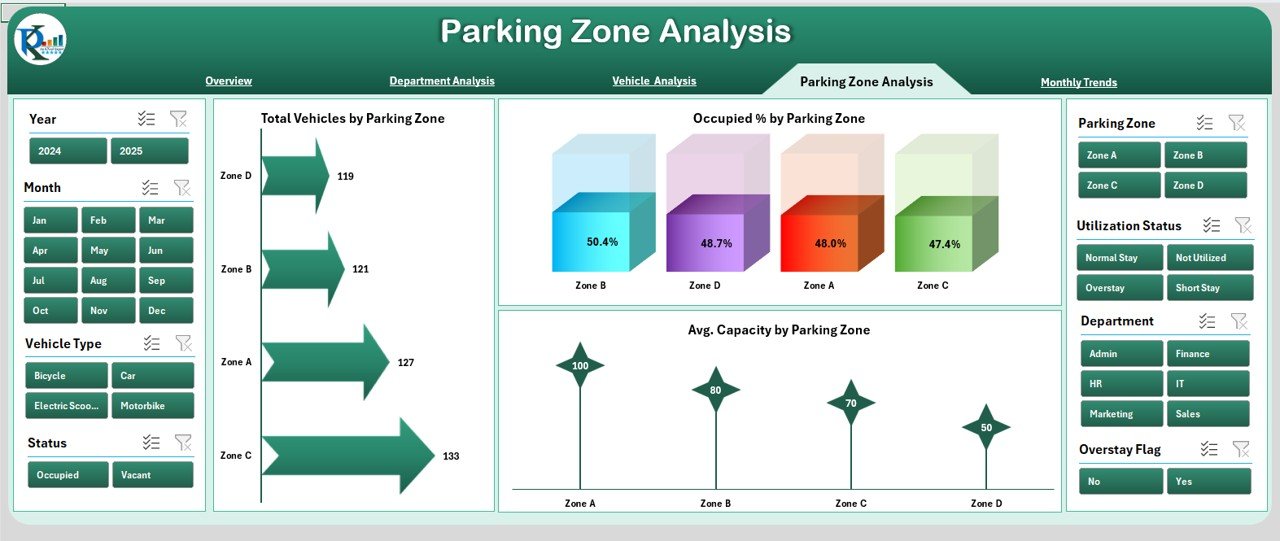
Parking Zone Analysis – Tracks occupancy and overstays by specific parking zones to identify high-demand areas.
-
Monthly Trends – Shows long-term parking patterns and seasonal variations for better forecasting.
-
Data Sheet – Stores all raw parking data; supports both manual entry and linked data imports.
-
Support Sheet – Contains dropdown values for departments, vehicle types, and parking zones to keep reporting consistent.
🛠 How to Use the Office Parking Utilization Dashboard
-
Collect Parking Data – Record daily entries, exits, vehicle types, and durations.
-
Update the Data Sheet – Input or import parking usage details.
-
Filter with Slicers – Narrow insights by department, vehicle type, parking zone, or timeframe.
-
Analyze Insights – Identify patterns in vacancy, overstay, and high-demand areas.
-
Take Action – Adjust allocations, improve visitor parking policies, or reassign zones.
🎯 Who Can Benefit from This Dashboard
🏢 Facility Managers – Optimize parking resources and resolve allocation disputes.
👩💼 HR & Admin Teams – Improve employee satisfaction by ensuring fair parking distribution.
🚙 Operations Teams – Monitor overstay patterns and vehicle type distribution.
📊 Executives – Use data-driven insights to reduce costs and plan expansions wisely.
🚀 Why This Dashboard is a Must-Have
-
Cost Savings – Avoid unnecessary expansions by maximizing existing space.
-
Improved Allocation – Assign spaces based on actual usage data.
-
Employee Satisfaction – Reduce parking stress with better planning.
-
Real-Time Insights – Identify issues like prolonged overstays immediately.
-
Seasonal Planning – Use historical trends to prepare for peak demand.
📖 Click here to read the Detailed blog post
Visit our YouTube channel to learn step-by-step video tutorials


Reviews
There are no reviews yet.