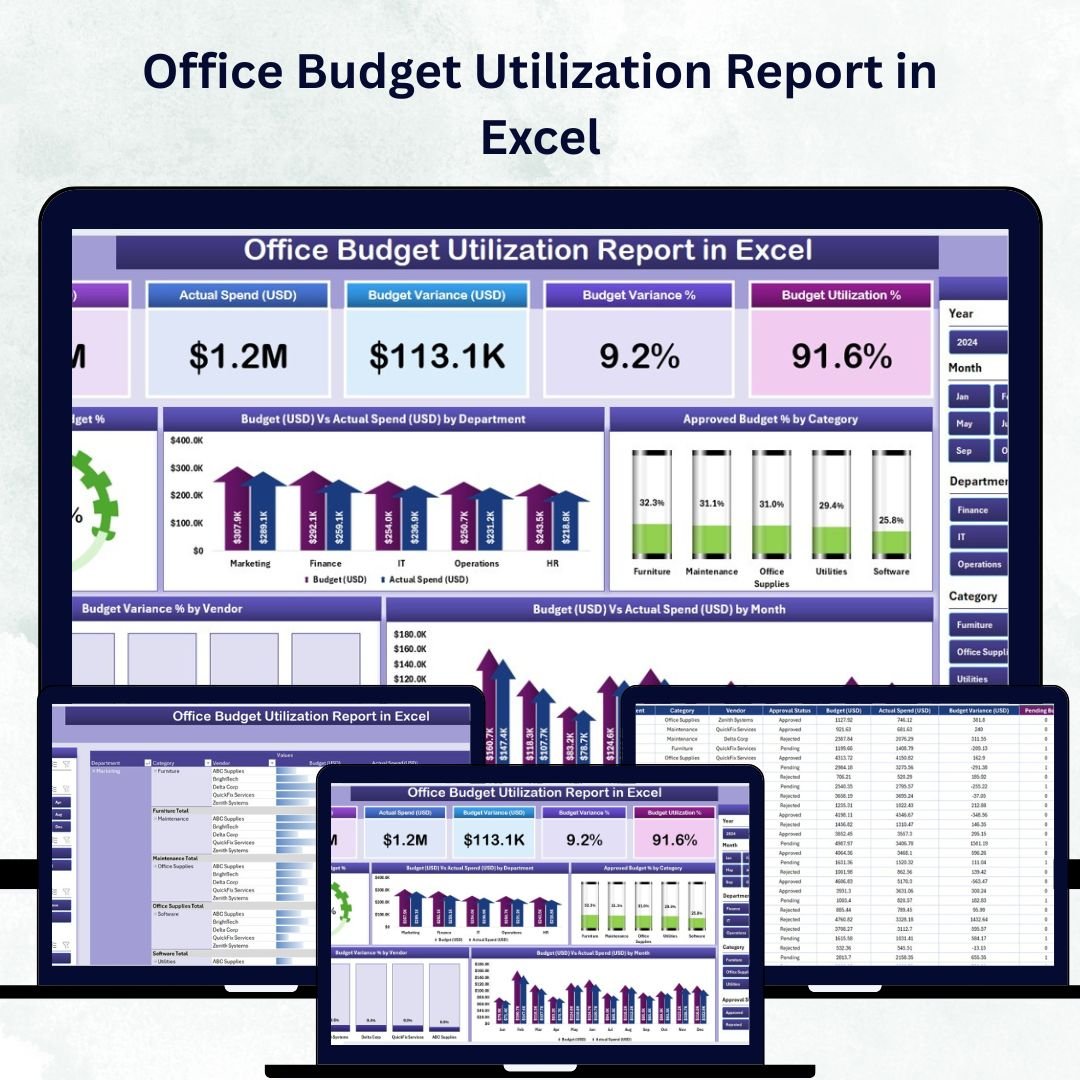
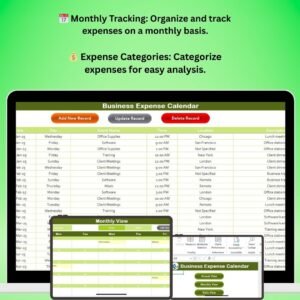
Keeping your office budget on track is vital for ensuring financial stability and business growth. The Office Budget Utilization Report in Excel is a powerful, ready-to-use tool that allows you to monitor budget performance, analyze spending patterns, and make informed financial decisions — all within one smart Excel dashboard.
Designed for finance managers, business owners, and project leads, this template offers a real-time view of approved budgets, actual expenses, and variance percentages, helping you pinpoint overspending areas and discover opportunities for cost savings.
Unlike complex accounting software, this Excel-based solution gives you clarity, simplicity, and control — so you can manage budgets confidently without requiring advanced technical skills.
⚙️ Key Features of the Office Budget Utilization Report in Excel
📊 Three Insightful Pages + Support Sheet:
Includes a Summary Page, Report Page, and Data Sheet, along with a Support Sheet for dropdowns and references — ensuring seamless data automation and interactivity.
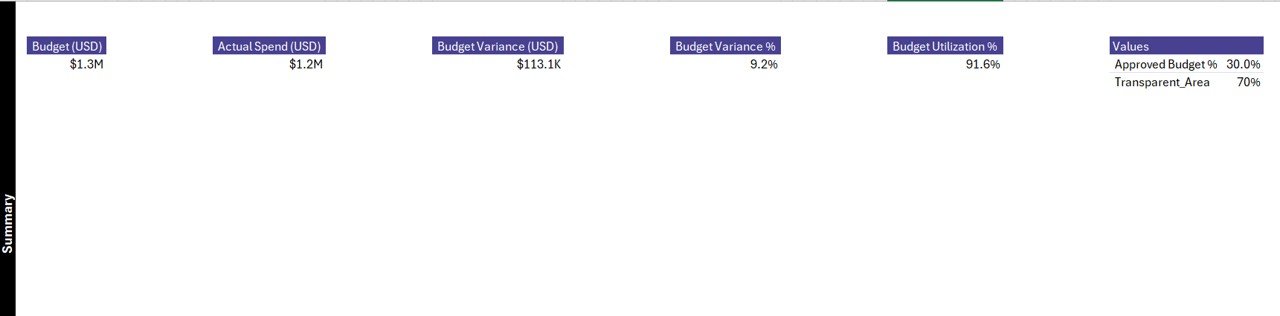
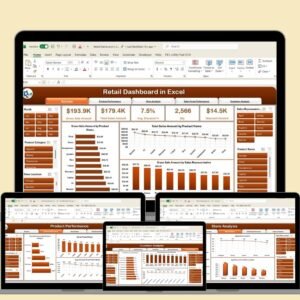
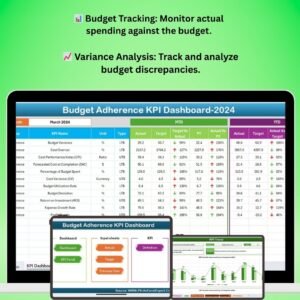
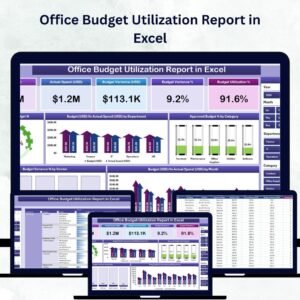
💼 Summary Page – The Financial Dashboard:
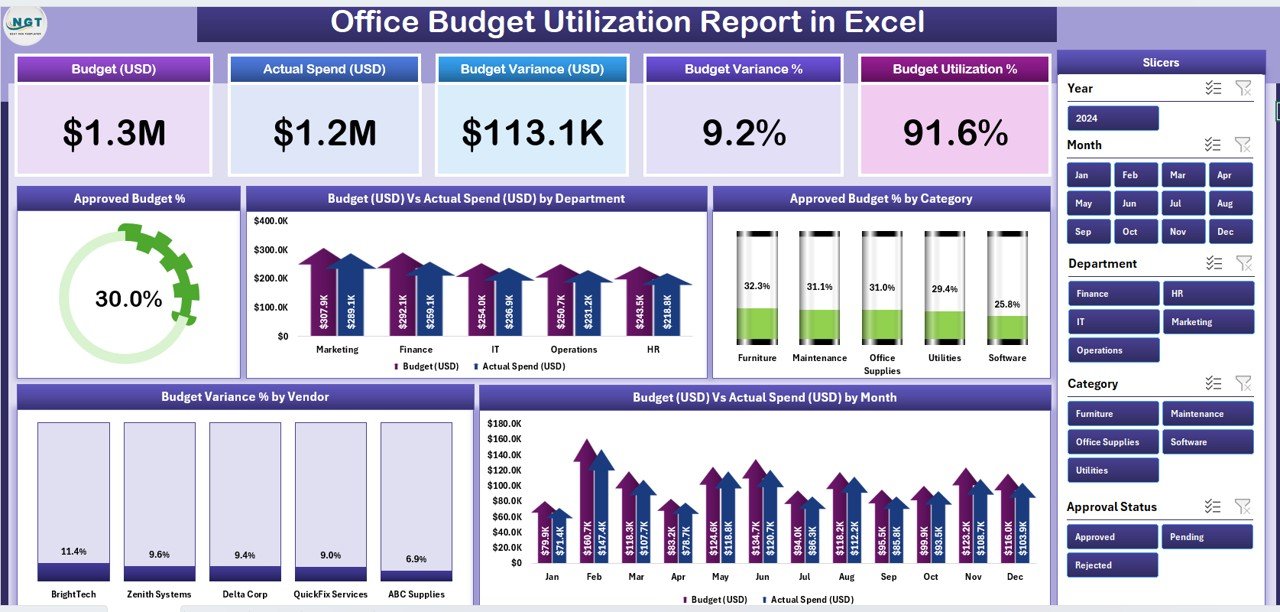
A high-level view of your organization’s financial performance.
-
Top 5 KPI Cards: Instantly see Total Budget, Total Actual Spend, Budget Utilization %, Budget Variance %, and Remaining Budget.
-
Interactive Slicers: Filter the report by Department, Vendor, or Month with one click.
-
Dynamic Charts:
-
Approved Budget %
-
Budget vs Actual Spend by Department
-
Approved Budget % by Category
-
Budget Variance % by Vendor
-
Budget vs Actual Spend by Month
-
This page delivers an at-a-glance financial summary for management reviews and quick insights.
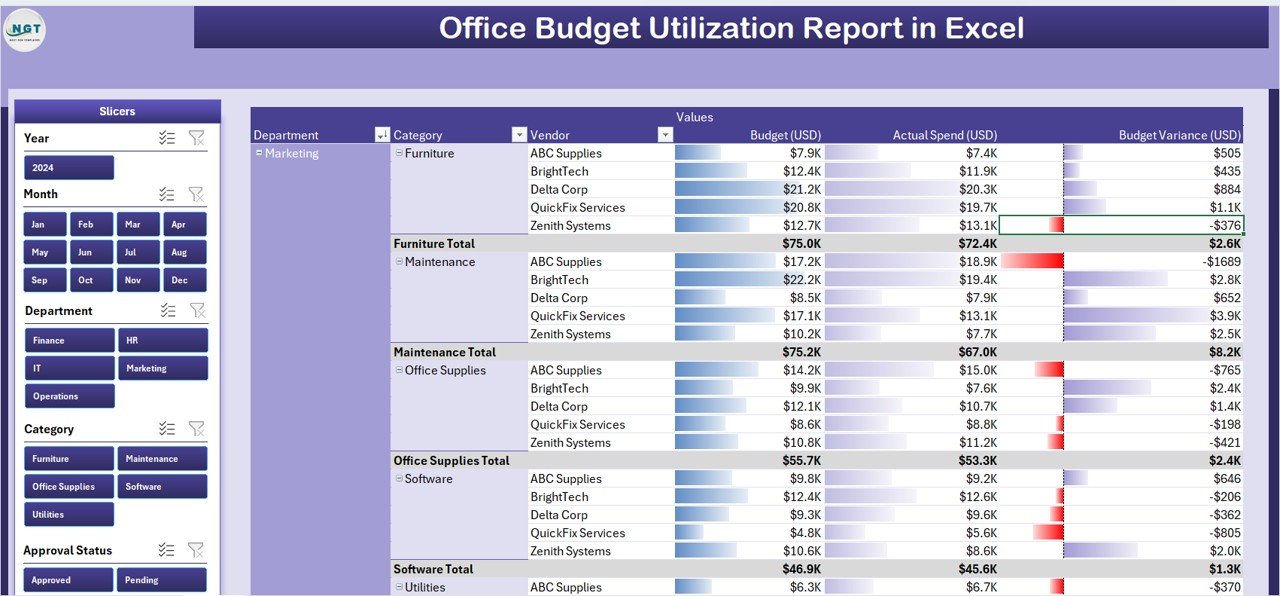
📑 Report Page – Detailed Financial Analysis:
Perfect for finance teams needing an in-depth view of spending.
-
Left-Side Filters: Quickly narrow data by Department, Vendor, or Category.
-
Comprehensive Table: Displays Approved Budget, Actual Spend, Budget Variance %, Vendor Details, and Month.
Identify cost overruns and spending trends instantly.
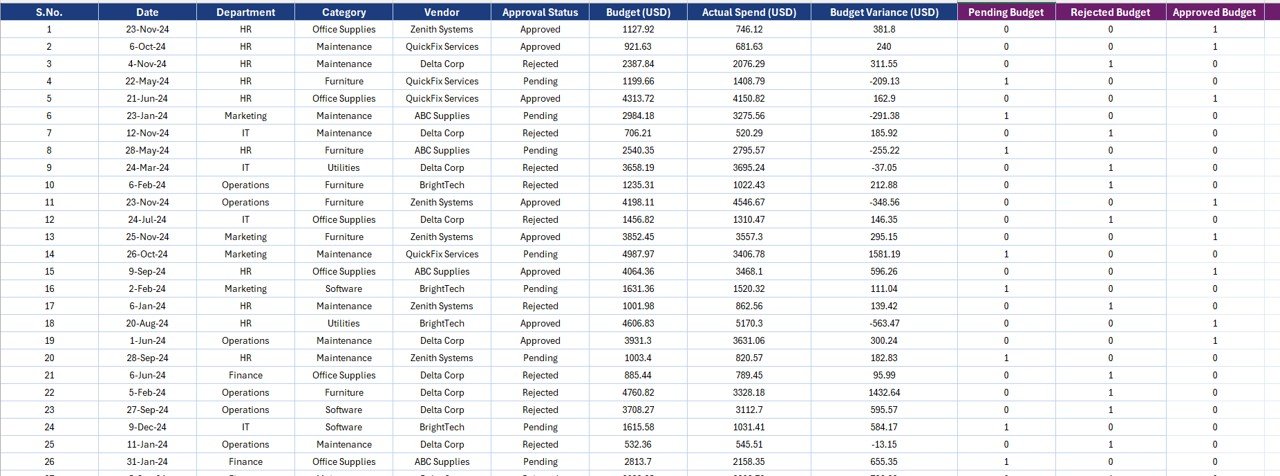
📂 Data Sheet – The Backbone of Your Report:
Stores all raw data, including department-wise budgets, vendor costs, and monthly expenditures.
Update your data here and watch all visuals and KPIs auto-refresh.
🧾 Support Sheet – Smart Automation:
Contains dropdown lists, lookup tables, and formula references that power slicers and ensure data consistency across all sheets.
📊 What’s Inside the Office Budget Utilization Report in Excel
1️⃣ Summary Page: Visual dashboard for leadership overviews.
2️⃣ Report Page: Department- and vendor-level detailed report.
3️⃣ Data Sheet: Cleanly structured raw data for pivots and charts.
4️⃣ Support Sheet: Dropdowns and formula support for automation.
Together, these sheets create a complete, self-refreshing system for tracking financial performance — no coding required.
🧭 How to Use the Office Budget Utilization Report in Excel
✅ Step 1: Enter your organization’s data into the Data Sheet (Department, Vendor, Approved Budget, Actual Spend, etc.).
✅ Step 2: Excel automatically calculates Variance %, Budget Utilization %, and Remaining Budget.
✅ Step 3: Explore pivot tables and charts that summarize results.
✅ Step 4: Use slicers on the Summary Page to filter data by Department, Vendor, or Month.
✅ Step 5: Review KPI Cards to monitor spending trends and financial health.
✅ Step 6: Export the dashboard as a PDF or share it directly with management.
Within minutes, your budget report becomes a professional, interactive financial dashboard.
👥 Who Can Benefit from This Report
💼 Finance Managers: Track and control departmental budgets efficiently.
🏢 Business Owners: Monitor cash flow and profitability.
📊 Project Managers: Ensure project funds are utilized effectively.
🧾 Operations Teams: Analyze vendor expenses and procurement costs.
📈 Corporate Leaders: Get real-time visibility into financial performance.
🌟 Advantages of the Office Budget Utilization Report in Excel
✅ Centralized Budget Tracking: All financial data in one place for better visibility.
✅ Real-Time Monitoring: Instantly view how much of the budget has been spent and what remains.
✅ Visual Insights: Easy-to-understand KPIs, variance charts, and color-coded visuals.
✅ Automation & Accuracy: Pivot tables and formulas reduce manual errors.
✅ Customization Flexibility: Add or remove KPIs, departments, or vendors effortlessly.
✅ Time Savings: No need for complex systems — everything updates automatically in Excel.
✅ Offline Usability: Works anywhere without internet or additional software.
✅ Scalability: Suitable for small offices or large enterprises alike.
🔗 Click here to read the Detailed Blog Post
🎥 Visit our YouTube channel for step-by-step tutorials
🔗 YouTube.com/@PKAnExcelExpert


Reviews
There are no reviews yet.