
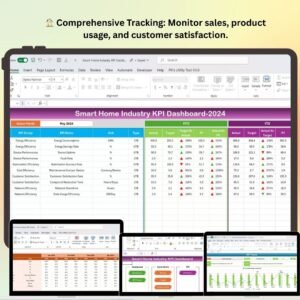
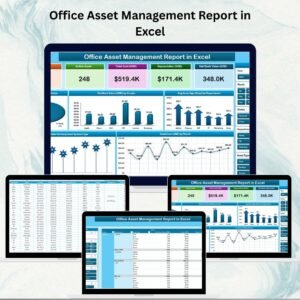
🖥️ Office Asset Management Report in Excel
As your organization grows, so does the number of laptops, printers, furniture, tools, and licenses that need to be managed. Tracking these assets manually across different spreadsheets often leads to errors, duplicate entries, unnecessary expenses, and operational delays.
The Office Asset Management Report in Excel solves this problem with a centralized, easy-to-use dashboard that gives you full visibility over all your office assets in real time.
This ready-to-use Excel template transforms raw asset data into visual KPIs, charts, and dynamic reports. Whether you need to track warranty status, asset age, cost, or vendor performance, this report brings everything together in one place — without the need for complex software or coding skills.
✨ Key Features of the Office Asset Management Report
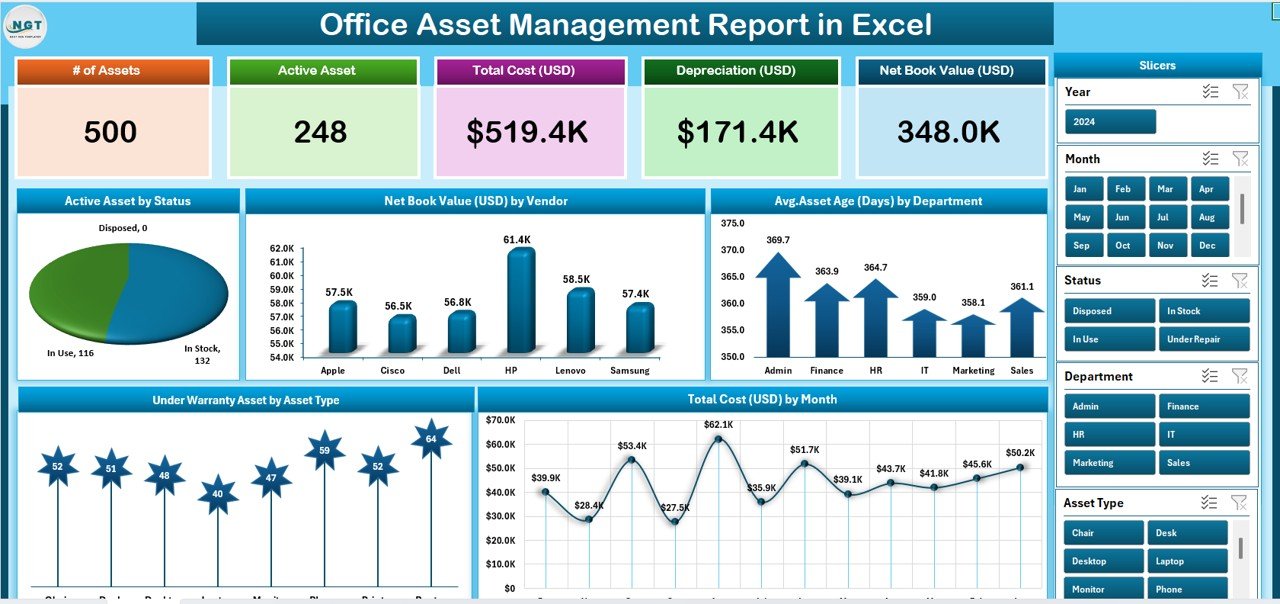
✅ Summary Page (Dashboard View)
-
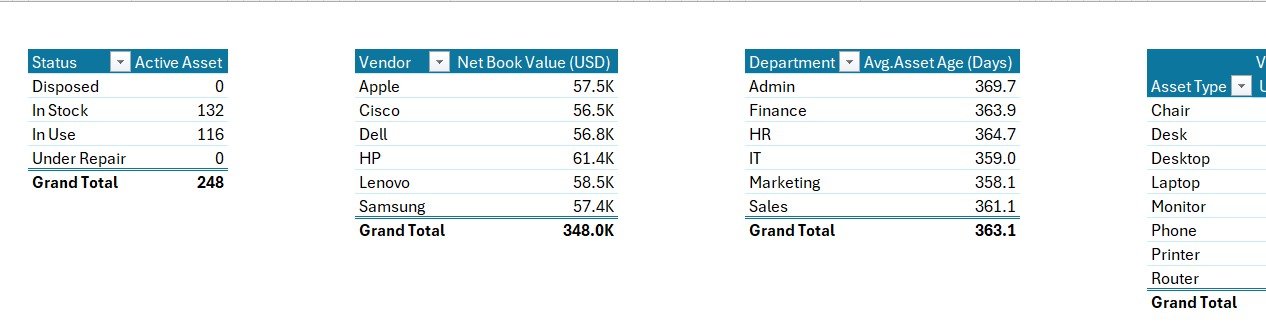
Total Active Assets
-
Net Book Value (USD)
-
Average Asset Age (Days)
-
Under Warranty Assets
-
Total Asset Cost (USD)
-
Interactive charts:
• Active Assets by Status
• Net Book Value by Vendor
• Average Age by Department
• Under Warranty by Asset Type
• Total Cost by Month -
Right-hand slicers to filter by Department, Vendor, or Asset Type
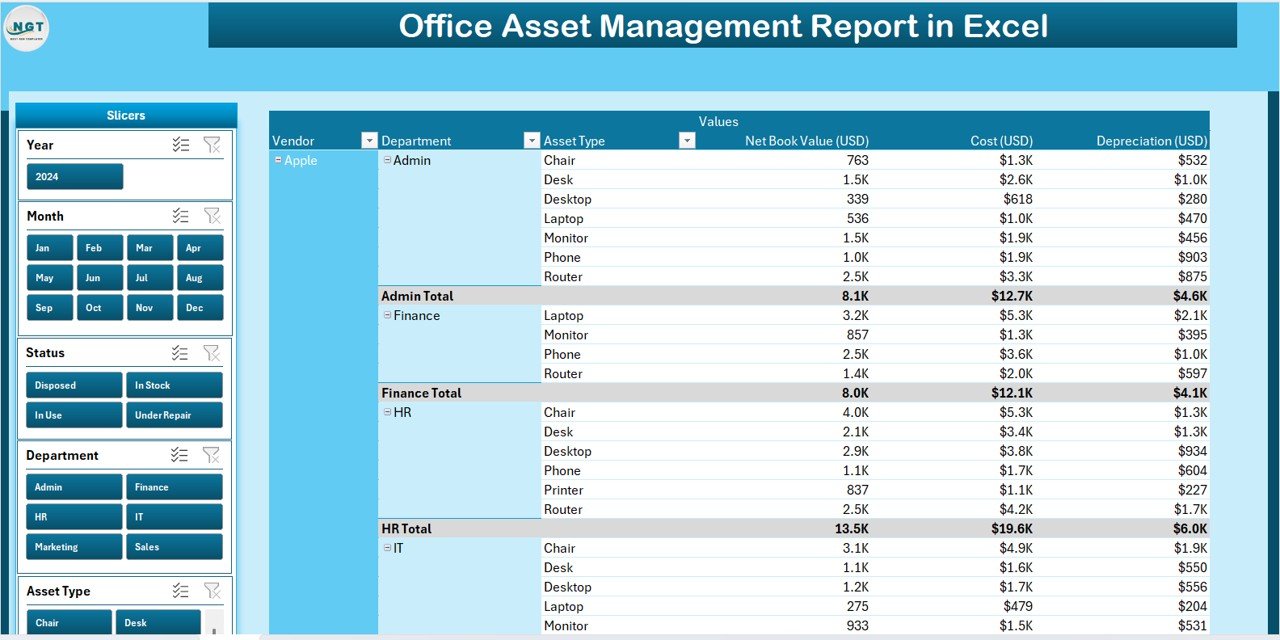
✅ Report Page (Detailed View)
-
Full table with asset-level details
-
Slicers for fast filtering
-
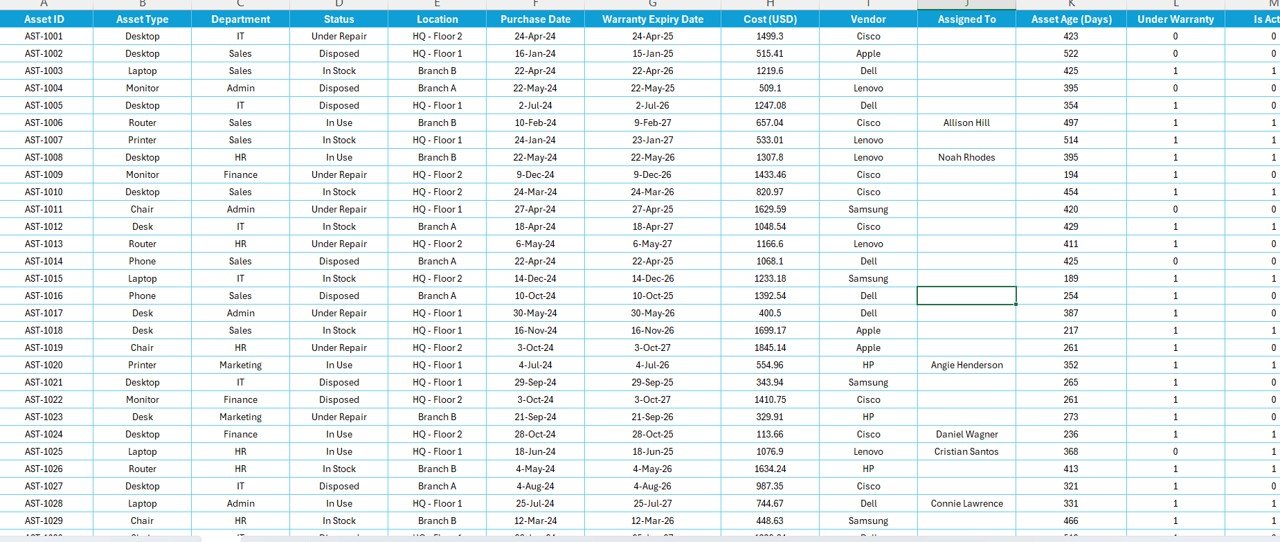
Display fields like Asset ID, Purchase Date, Cost, Status, Warranty, Remaining Life
✅ Data Sheet (Raw Data Entry)
-
Simple structured table for entering purchase data, cost, warranty, vendor, department, etc.
-
Dashboard updates automatically once data is refreshed
✅ Support Sheet
-
Reference lists for drop-downs (Departments, Vendors, Asset Types)
-
Keeps inputs consistent and prevents manual entry errors
🛠 How to Use the Asset Management Report
-
Collect Data – Gather asset details (purchase dates, costs, vendor, status, etc.).
-
Enter Into Data Sheet – Use predefined fields to input your data.
-
Refresh the Dashboard – Click Data → Refresh All to update all charts and KPIs.
-
Review the Summary Page – Analyze the top-level KPIs and filter to specific departments or vendors.
-
Drill Down in the Report Page – Use slicers to investigate specific assets and export if needed.
-
Repeat Regularly – Update the Data Sheet weekly or monthly to keep the report accurate and up to date.
🎯 Who Can Benefit from This Report
🏢 Office Administrators – Track asset lifecycle and warranty renewals
💼 Operations Managers – Identify aging assets and plan replacements
🧾 Finance Teams – Monitor total asset cost and net book value
🛠️ IT Departments – Maintain visibility over hardware/software inventory across departments
🚀 Benefits of Using This Excel-Based Report
-
Real-Time Visibility of all office assets
-
Better Decision-Making with visual KPIs and charts
-
Accurate Warranty & Lifecycle Tracking
-
Budget Planning Support (Net Book Value & Replacement Forecasting)
-
Easy Customization – No coding, 100% Excel
-
Reduced Risk – Fewer errors and missed renewals
-
Zero Subscription Cost – Works offline in Excel


Reviews
There are no reviews yet.