

Protecting our oceans is one of the world’s most urgent environmental priorities. Marine ecosystems regulate climate, support biodiversity, and sustain millions of communities through fisheries, tourism, and coastal livelihoods. To safeguard these resources, conservation programs must monitor water quality, track marine life recovery, measure pollution reduction, and evaluate coastal health—all using accurate, structured, and real-time data.
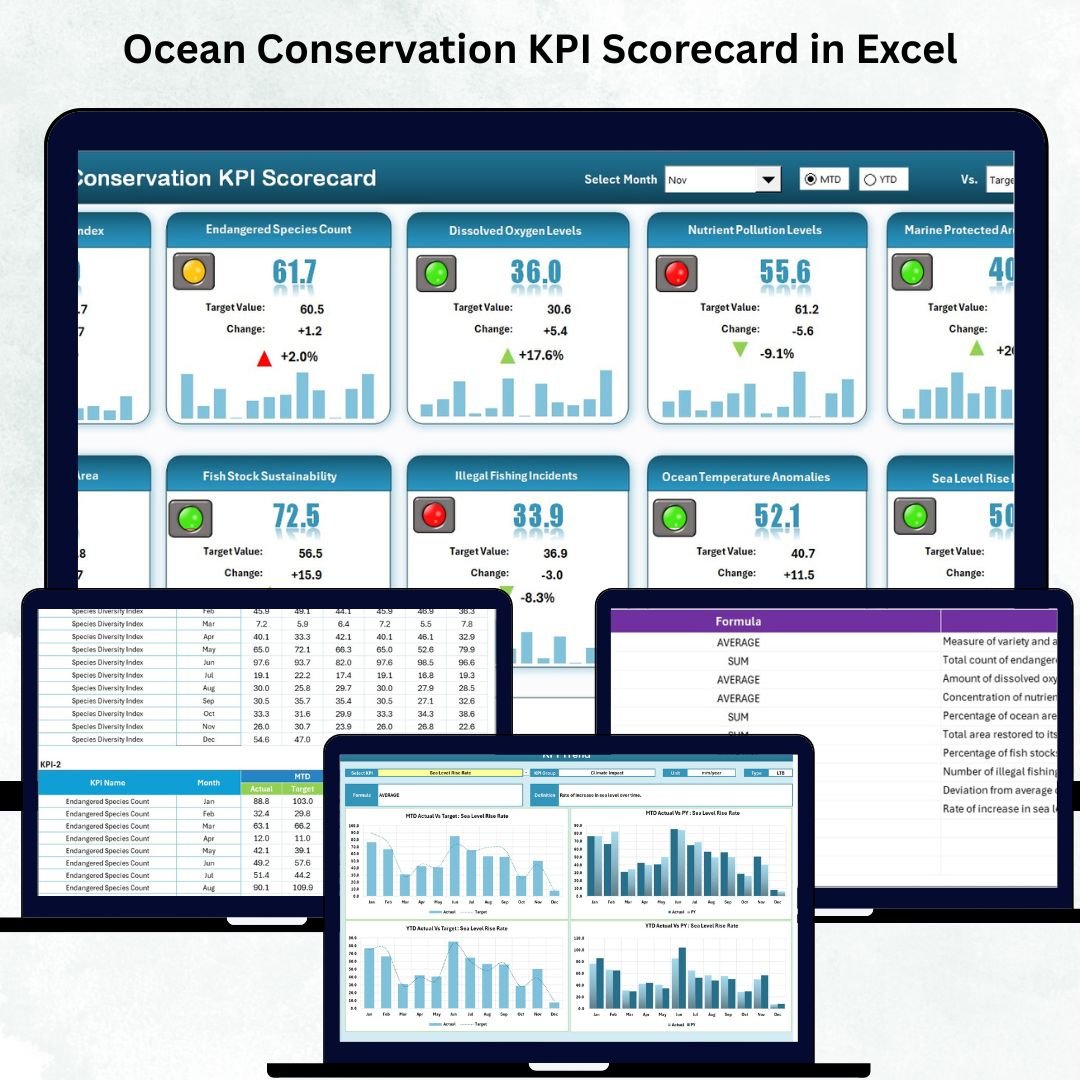
The Ocean Conservation KPI Scorecard in Excel is a powerful, ready-to-use reporting system designed to help conservation teams evaluate their progress with clarity and confidence. Whether you’re monitoring plastic waste cleanup, coral reef restoration, fish population recovery, or coastal biodiversity improvement, this scorecard brings all environmental KPIs into one visual and interactive Excel dashboard.
Because it uses Excel, anyone—from researchers and NGOs to government teams and marine conservation volunteers—can analyze complex ecological data without advanced technical tools. With MTD/YTD comparisons, trend charts, color-coded indicators, and structured KPI definitions, this scorecard transforms raw environmental data into meaningful insights that help organizations take timely, informed action.
✨ Key Features of the Ocean Conservation KPI Scorecard in Excel
📊 Scorecard Sheet – Your Complete Marine KPI Overview
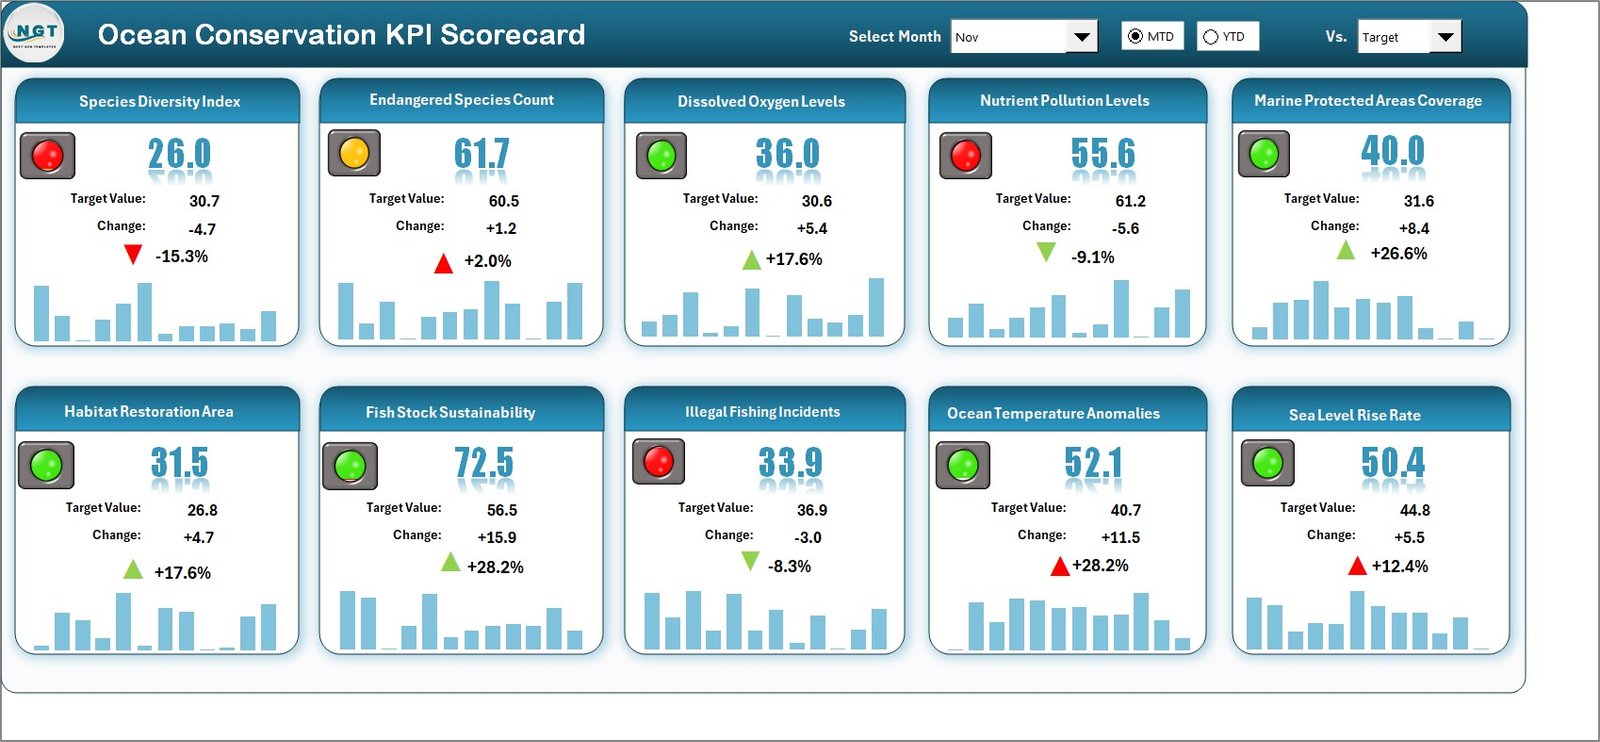
The Scorecard Sheet acts as the main dashboard, showing all conservation KPIs in one clear format.
-
🔽 Dropdown Filters – Select the month and choose MTD or YTD analysis instantly.
-
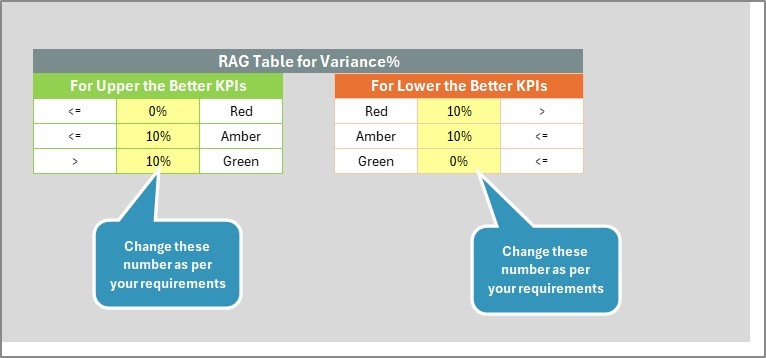
🎯 Actual vs Target Comparison – Evaluate whether conservation targets are achieved or missed.
-
🚦 Color-Coded Indicators – Green, yellow, and red indicators simplify performance review.
-
📋 Comprehensive KPI Display – View KPI values, UTB/LTB type, and monthly comparisons on a single screen.
This page provides a real-time, high-level snapshot of the overall conservation program.
📈 KPI Trend Sheet – Track Ecosystem Progress Over Time
Marine recovery takes months or even years. This Trend Sheet helps teams monitor long-term changes.
-
➤ KPI Selection (C3) – Choose a KPI to view detailed charts.
-
📘 Automated KPI Details – View KPI Group, Unit, Formula, Type & Definition automatically.
-
📊 MTD & YTD Trend Charts – Compare Actual vs Target vs Previous Year values.
These visuals help conservation teams identify seasonal changes, growth patterns, and emerging risks.
🧮 Input Data Sheet – Easy Monthly Data Entry
This sheet stores all MTD, YTD, target, and previous year readings for every KPI.
-
Simple rows/columns for clean data entry
-
Fully linked to the Scorecard & Trend Sheets
-
Automatically updates charts when refreshed
Accurate data ensures accurate reporting—making this sheet the backbone of the scorecard.
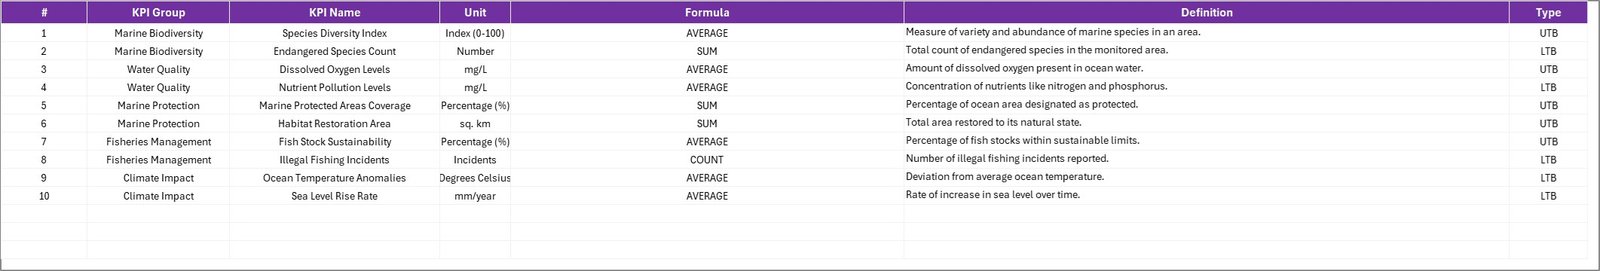
📘 KPI Definition Sheet – Standardize Marine KPIs
Consistency is vital in environmental reporting.
This sheet includes:
-
KPI Name
-
KPI Group
-
Unit of Measurement
-
Formula
-
KPI Definition
It ensures clarity and keeps teams aligned with reporting standards.
📘 What’s Inside the Ocean Conservation KPI Scorecard in Excel
-
Scorecard Dashboard
-
KPI Trend Sheet
-
Input Data Sheet
-
KPI Definition Sheet
This structure gives teams everything they need to record, analyze, and improve marine conservation initiatives.
🛠 How to Use the Ocean Conservation KPI Scorecard in Excel
Step 1: Update the Input Data Sheet
Enter actual values, targets, and previous-year numbers every month.
Step 2: Refresh All
Go to Data → Click Refresh All
Your Scorecard and Trend pages update instantly.
Step 3: Study Scorecard Outputs
Use dropdowns to toggle months and view MTD/YTD insights.
Step 4: Analyze Trends for Deeper Insights
Use the Trend Sheet to understand long-term ecological shifts.
Step 5: Update KPI Definition Sheet (Optional)
Add new KPIs as your conservation project expands.
🎯 Who Can Benefit from This Ocean Conservation KPI Scorecard
🌊 Marine Conservation Organizations
Track coral health, water clarity, marine biodiversity, and pollution levels.
🧑🔬 Environmental Researchers
Analyze seasonal and year-on-year environmental patterns.
🏛️ Government Environment Departments
Measure progress toward conservation targets and policies.
🌍 NGOs & Ocean Advocacy Groups
Monitor cleanup programs, species recovery, and coastal protection activities.
🐠 Marine Biology Teams
Evaluate species population growth, habitat restoration, and pollution threats.


Reviews
There are no reviews yet.