


In an era where health awareness and personalized nutrition are transforming lifestyles, professionals in nutrition and dietetics need smarter ways to manage, analyze, and present data. Tracking consultations, meal plans, satisfaction ratings, and profits manually can be time-consuming and error-prone.
That’s why the Nutrition & Dietetics Dashboard in Excel was created — a fully interactive, ready-to-use analytics template designed for nutritionists, dieticians, wellness centers, and health startups. Built with Excel’s powerful pivot tables, charts, and slicers, this dashboard turns raw data into meaningful insights — helping you make informed decisions, improve client outcomes, and maximize business performance. 💼📊
With this dashboard, you can monitor consultation trends, profit margins, satisfaction ratings, and plan performance — all in one elegant, easy-to-navigate Excel workbook.
🌟 Key Features of the Nutrition & Dietetics Dashboard in Excel
🏠 Overview Page – Your Command Center

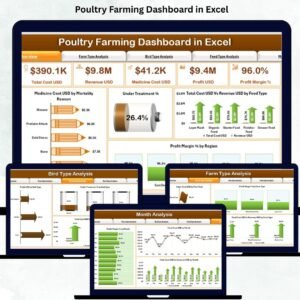
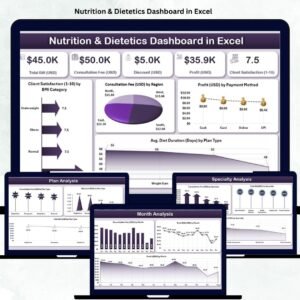
Get a clear snapshot of your practice performance with five KPI cards and four dynamic charts.
-
Charts Included:
-
Client Satisfaction (1–10) by BMI Category
-
Consultation Fee (USD) by Region
-
Profit (USD) by Payment Method
-
Average Diet Duration (Days) by Plan Type
Track how your business performs across specialties, locations, and payment channels — instantly spotting improvement areas and high-performing zones.
-
🧑⚕️ Specialty Analysis Page
Understand profitability by specialization — from sports nutrition to diabetic care.
-
Consultation Fee (USD) by Specialty
-
Total Bill (USD) by Specialty
-
Profit (USD) by Specialty
Identify which specializations bring the highest revenue and client satisfaction, helping you refine pricing and focus on profitable niches.
📋 Plan Analysis Page
Compare the effectiveness of different plans — detox, weight management, diabetic, and more.
-
Consultation Fee (USD) by Plan Type
-
Total Bill (USD) by Plan Type
-
Profit (USD) by Plan Type
Use these insights to optimize diet plans for better results and higher client retention.
🏥 Clinic Analysis Page
Manage multiple clinics or branches effortlessly.
-
Consultation Fee (USD) by Clinic Name
-
Total Bill (USD) by Clinic Name
-
Profit (USD) by Clinic Name
Determine which locations perform best in revenue, profit, and engagement — and replicate success across all branches.
📆 Month Analysis Page
View your business performance over time.
-
Consultation Fee (USD) by Month
-
Total Bill (USD) by Month
-
Profit (USD) by Month
Spot seasonal trends, evaluate marketing effectiveness, and plan future strategies based on actual growth data.
📦 What’s Inside the Dashboard
✅ 5 Analytical Pages: Overview, Specialty, Plan, Clinic, and Month Analysis
✅ Dynamic KPI Cards: Instantly visualize key performance metrics
✅ Interactive Slicers: Filter data by region, month, or plan type
✅ Auto-Refreshing Charts: Update automatically when new data is added
✅ Professional Layout: Clean design suitable for presentations and reports
✅ Support Data Sheet: All metrics pull from one structured dataset for accuracy
🧭 How to Use the Dashboard
1️⃣ Enter Data: Fill in the Data Sheet with your client, clinic, or consultation details.
2️⃣ Refresh Dashboard: Click “Refresh All” to update all charts and KPI cards automatically.
3️⃣ Navigate Pages: Use the left-side Page Navigator to explore Overview, Plan, Clinic, and Month views.
4️⃣ Analyze Results: Filter by specialty, region, or payment method for precise insights.
5️⃣ Share & Present: Export visuals or share the Excel file for meetings or reports.
No advanced Excel skills required — it’s intuitive, automated, and professional! ⚡
👥 Who Can Benefit from This Dashboard
🥑 Individual Nutritionists: Manage multiple clients and monitor satisfaction scores.
💼 Clinic Managers: Track performance, profitability, and branch comparisons.
🧘 Wellness Centers: Combine diet and fitness data to deliver holistic insights.
🏥 Hospitals & Healthcare Units: Monitor specialty-wise consultation performance.
📊 Startups & Health Tech Firms: Use data visualization to optimize business growth.
This dashboard is your all-in-one data companion for improving outcomes, financial control, and strategic decision-making.
🌍 Why Choose This Excel Dashboard
✔️ Time-Saving Automation: No manual reports — just refresh and analyze.
✔️ Real-Time Insights: Instantly view the latest financial and satisfaction trends.
✔️ Financial Clarity: Compare profit and expenses by month or clinic.
✔️ User-Friendly Design: Built for non-technical users with easy navigation.
✔️ Scalable & Customizable: Add new KPIs, charts, or plan types anytime.
✔️ Professional Presentation: Ideal for client updates or investor meetings.
The Nutrition & Dietetics Dashboard in Excel gives you more than data — it gives you confidence in every business decision. 🌿📈
### Click here to read the Detailed blog post
Visit our YouTube channel to learn step-by-step video tutorials


Reviews
There are no reviews yet.