Managing a nonprofit organization requires passion, clarity, and strong performance tracking. Yet many nonprofits still struggle with scattered data, manual reporting, and limited visibility into their monthly and yearly progress. The Nonprofit Organizations KPI Dashboard in Power BI solves these challenges instantly. It gives you a smart, automated, and visually powerful way to track every donation, program, volunteer activity, and outreach effort—without spending hours on spreadsheets.
This ready-to-use dashboard transforms your raw Excel data into beautiful, interactive visuals that help your team understand performance within seconds. Whether you want to track program outcomes, measure fundraising success, improve accountability, or share transparent insights with donors—this dashboard becomes your all-in-one performance management system.
Designed for nonprofit leaders, program managers, fundraising teams, volunteers, and board members, this dashboard delivers complete clarity with zero technical difficulty. Simply update your Excel file, click refresh, and Power BI takes care of everything.
💡 Key Features of the Nonprofit Organizations KPI Dashboard in Power BI
This dashboard is packed with powerful features built especially for nonprofit organizations. Here’s what makes it exceptional:
✨ Smart Slicers for Quick Filtering – Switch between months and KPI groups instantly to view only the data you want.
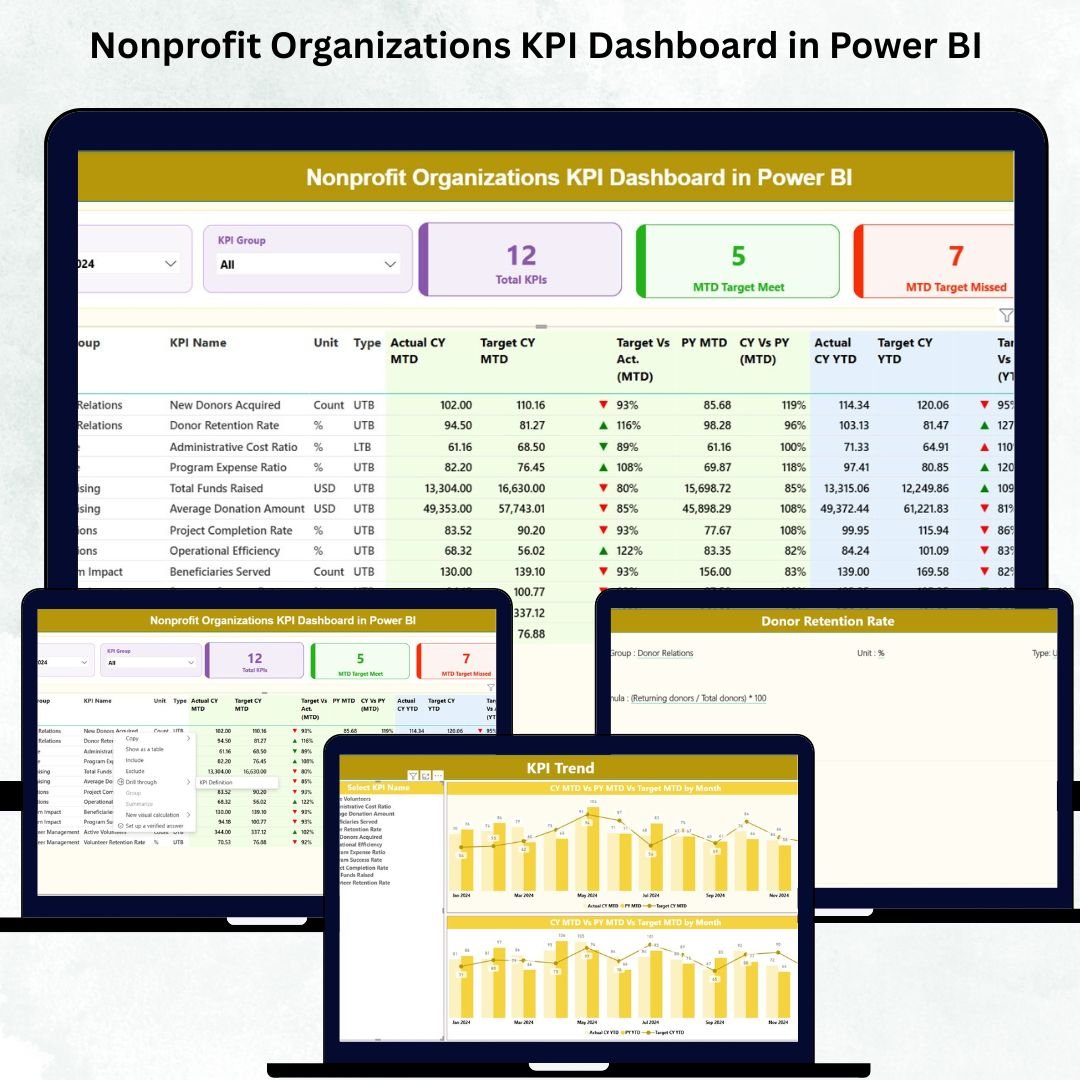
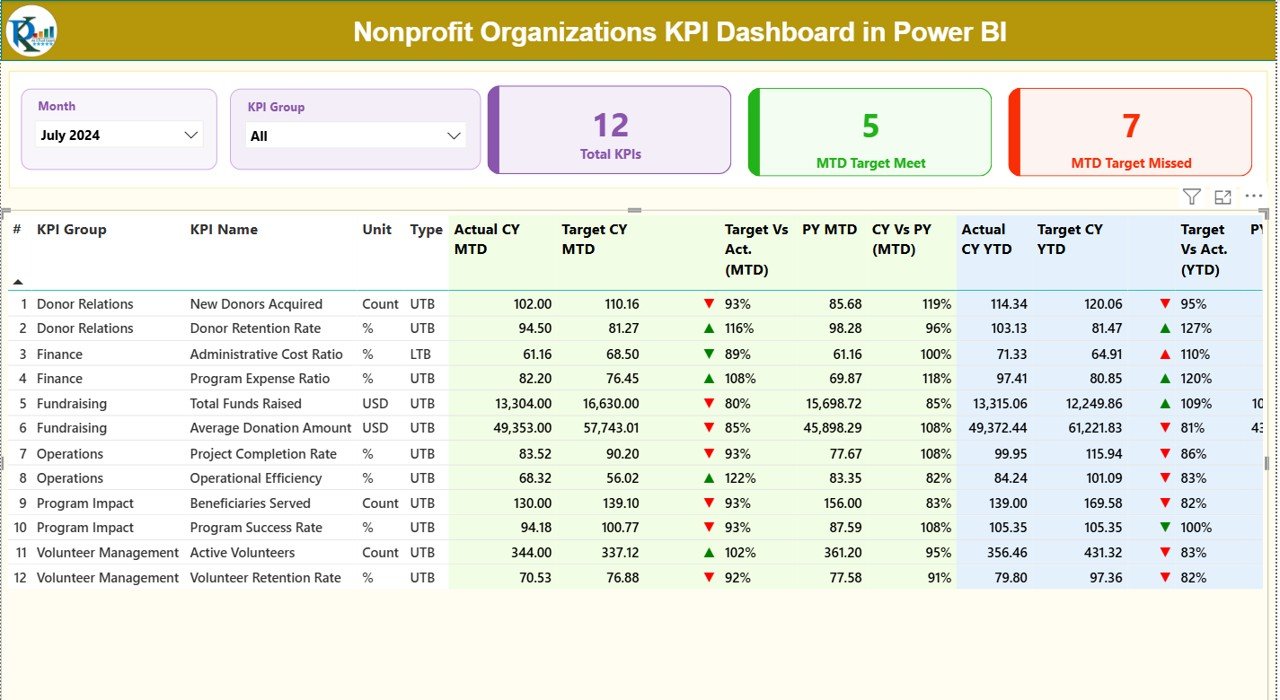
✨ KPI Cards for Fast Insights – View Total KPIs, MTD Target Met, and MTD Target Missed at a glance.
✨ Automatic MTD & YTD Calculations – Track short-term and long-term performance effortlessly.
✨ CY vs PY Comparison – Understand how your nonprofit is performing compared to last year.
✨ Color-Coded Icons – See red or green indicators for instant clarity on target achievement.
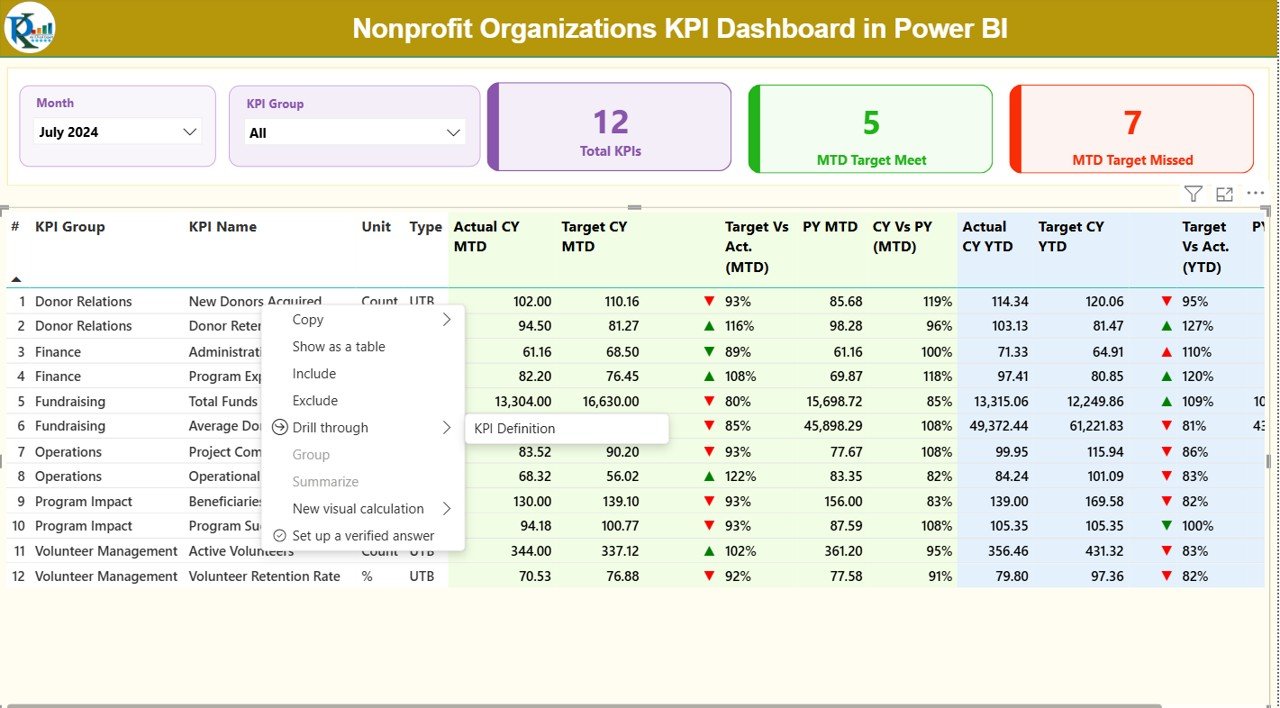
✨ Detailed KPI Table – Explore Actuals, Targets, Variance %, PY Comparisons, Icons, and more.
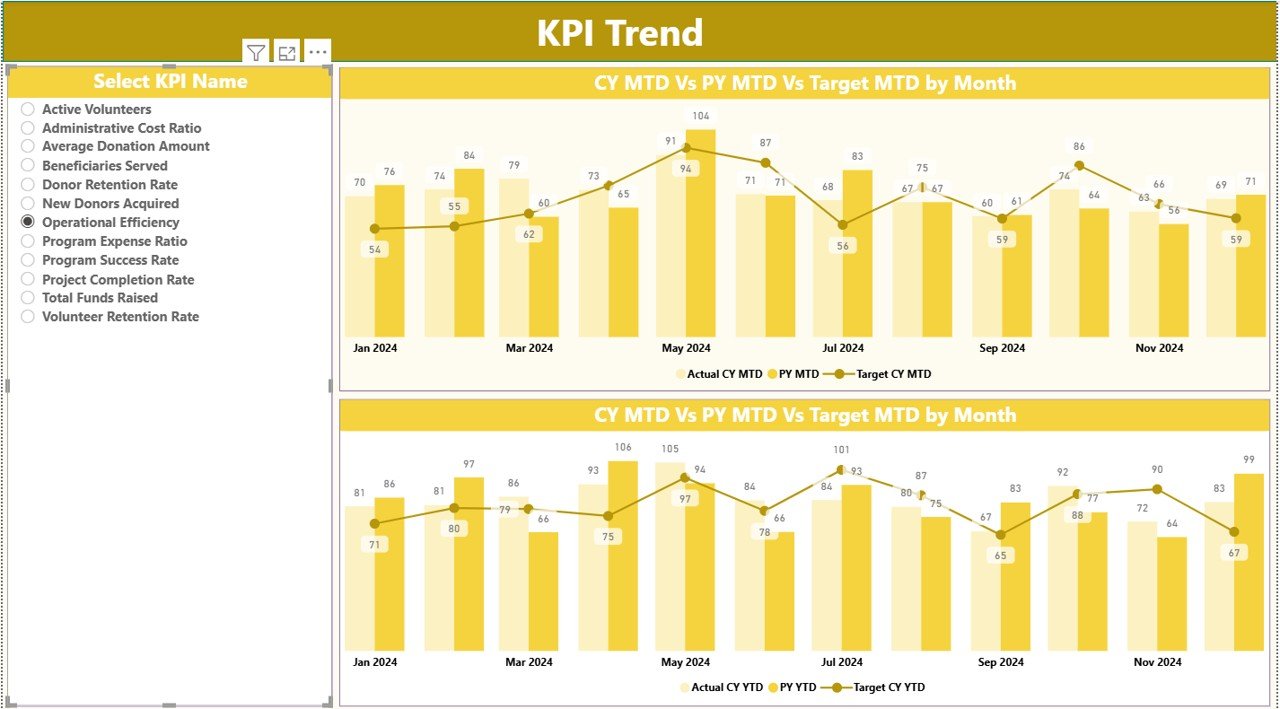
✨ Interactive Trend Charts – Analyze performance trends using dynamic MTD & YTD visuals.
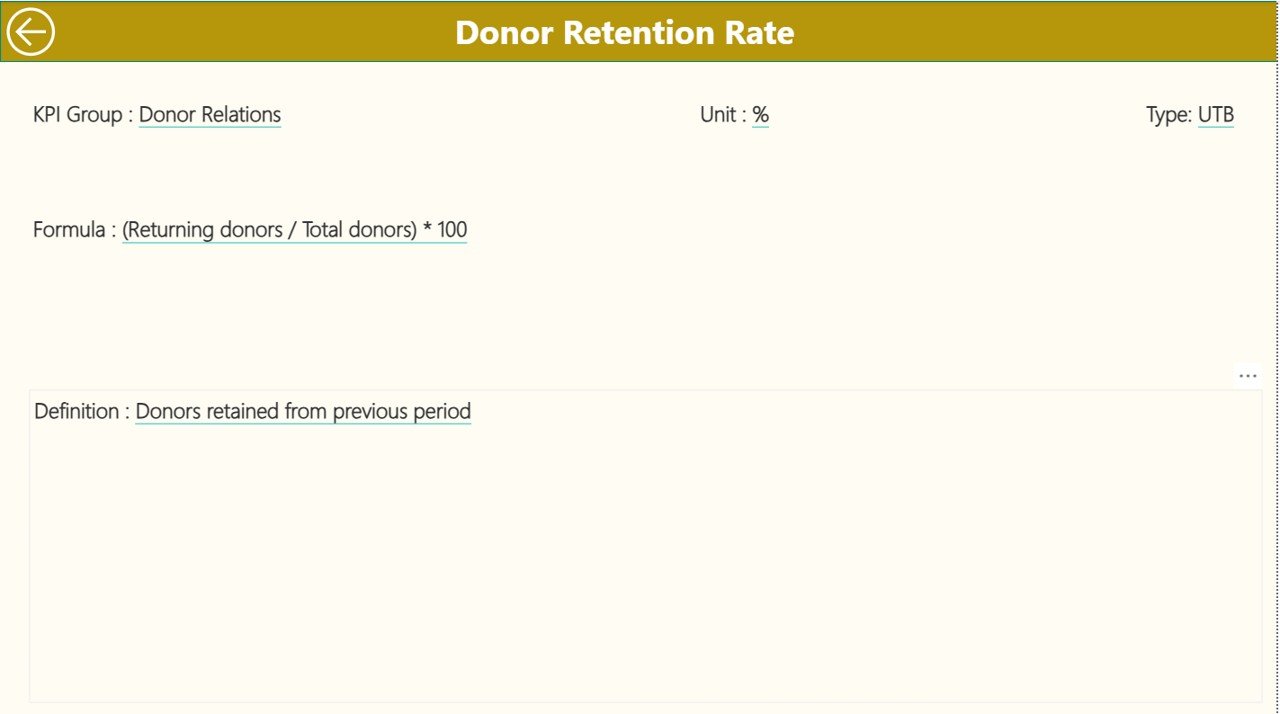
✨ Drill-Through KPI Definitions – Understand the logic, formula, and structure behind each KPI.
✨ Excel-Based Data Source – Simply fill in Excel sheets and the visuals update automatically.
With these features, your team will spend less time collecting data and more time improving impact.
📦 What’s Inside the Nonprofit Organizations KPI Dashboard in Power BI
Inside the download package, you get everything you need to run performance reporting smoothly:
📁 Power BI Dashboard (.PBIX File) – Fully dynamic and ready to use.
📁 Input_Actual Sheet – Fill in current MTD & YTD performance values.
📁 Input_Target Sheet – Enter target values for each KPI.
📁 KPI Definition Sheet – Add KPI names, groups, units, formulas, and definitions.
📁 Structured KPI Framework – Covers donations, fundraising, programs, volunteers, outreach, and finance.
📁 Three Dashboard Pages:
-
Summary Page – Overall KPI performance
-
KPI Trend Page – Month-wise performance movement
-
KPI Definition Page – Clear definitions for team awareness
Everything is pre-built, formatted, and ready for immediate use.
🛠️ How to Use the Nonprofit Organizations KPI Dashboard in Power BI
Using this dashboard is extremely simple—even for beginners:
1️⃣ Enter monthly data in the Input_Actual sheet (MTD & YTD values).
2️⃣ Update targets in the Input_Target sheet.
3️⃣ Add or modify KPIs using the KPI Definition sheet.
4️⃣ Open the Power BI file and click Refresh.
5️⃣ Use slicers to filter by Month or KPI Group.
6️⃣ Drill through to see KPI logic when required.
7️⃣ Use the Trend Page to explore month-wise performance movement.
8️⃣ Export reports for board meetings, donor communications, and presentations.
With this template, data entry takes minutes — but insights last all year.
👥 Who Can Benefit from This Nonprofit KPI Dashboard
This dashboard is perfect for every nonprofit role, including:
🌟 Nonprofit Leaders & Directors – Get complete visibility into impact and operations.
🌟 Fundraising Teams – Track donations, donor growth, fundraising ROI, and more.
🌟 Program Managers – Measure program outcomes, beneficiary reach, and efficiency.
🌟 Volunteer Coordinators – Track volunteer hours, engagement, and retention.
🌟 Finance & Compliance Teams – Review YTD trends, budgets, and grant performance.
🌟 Board Members – Receive transparent, visual insights during meetings.
🌟 Donors & Stakeholders – Gain confidence through clear performance reporting.
🌟 Small Nonprofits – Use a simple Excel-to-Power BI system without technical complexity.
Whether your nonprofit is big or small, this dashboard ensures every action leads to measurable impact.
Click here to read the Detailed blog post
Watch the step-by-step video tutorial:


Reviews
There are no reviews yet.