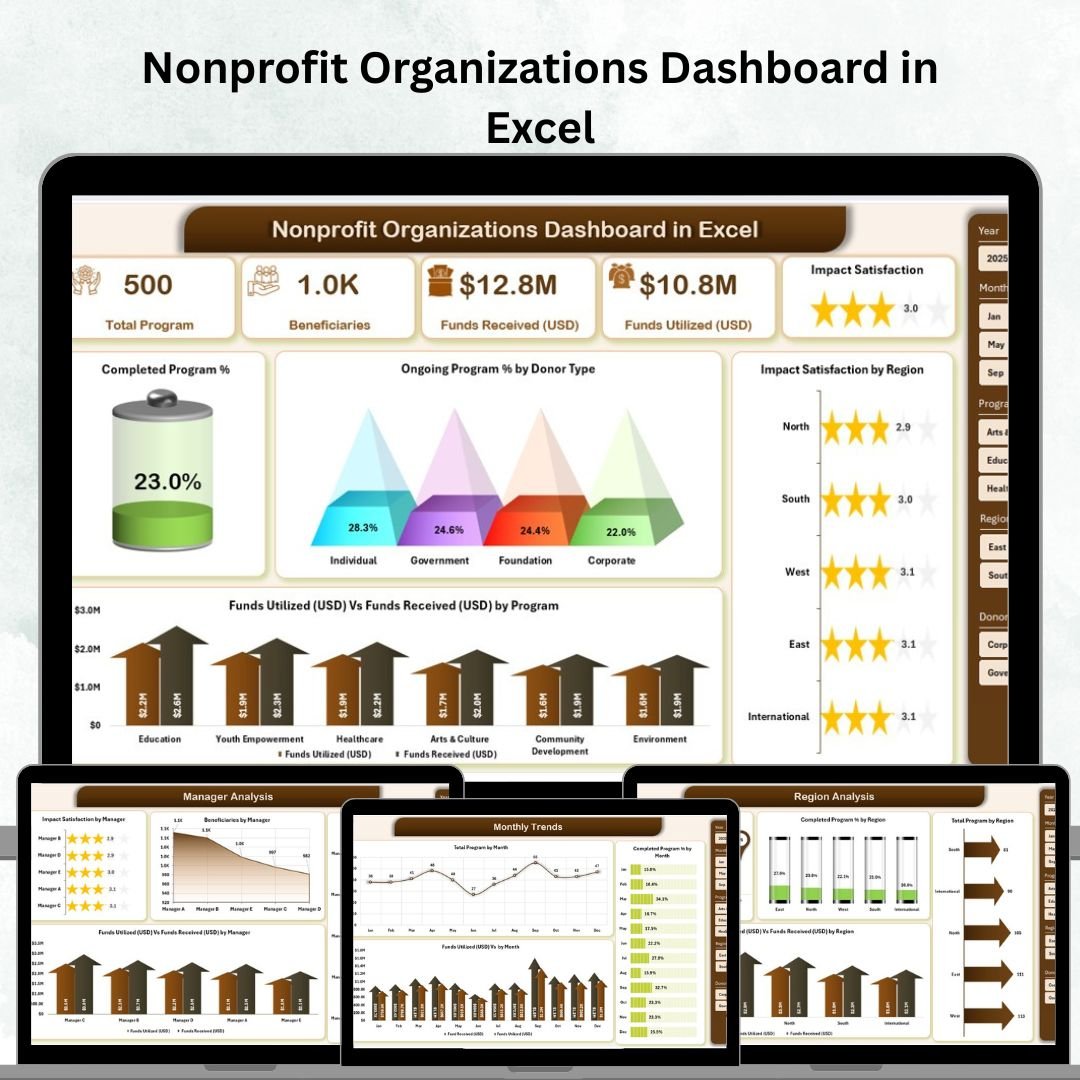
Nonprofit organizations are driven by purpose but often challenged by limited resources, multiple programs, and the constant need for accountability. Donors, stakeholders, and boards expect clear visibility into how funds are used and what impact has been created. This is where the Nonprofit Organizations Dashboard in Excel comes in—a complete performance management solution designed to give nonprofits transparency, efficiency, and trust.
With this ready-to-use dashboard, you can centralize program, regional, and manager-level data into one simple yet powerful tool. Instead of scattered spreadsheets or manual reports, everything is consolidated into interactive Excel pages with slicers, pivot tables, and charts. Whether you’re managing 3 programs or 30, this dashboard provides clarity and confidence to make smarter decisions.
✨ Key Features of the Nonprofit Organizations Dashboard
✅ Page Navigator – Easy navigation on the left side for quick access.
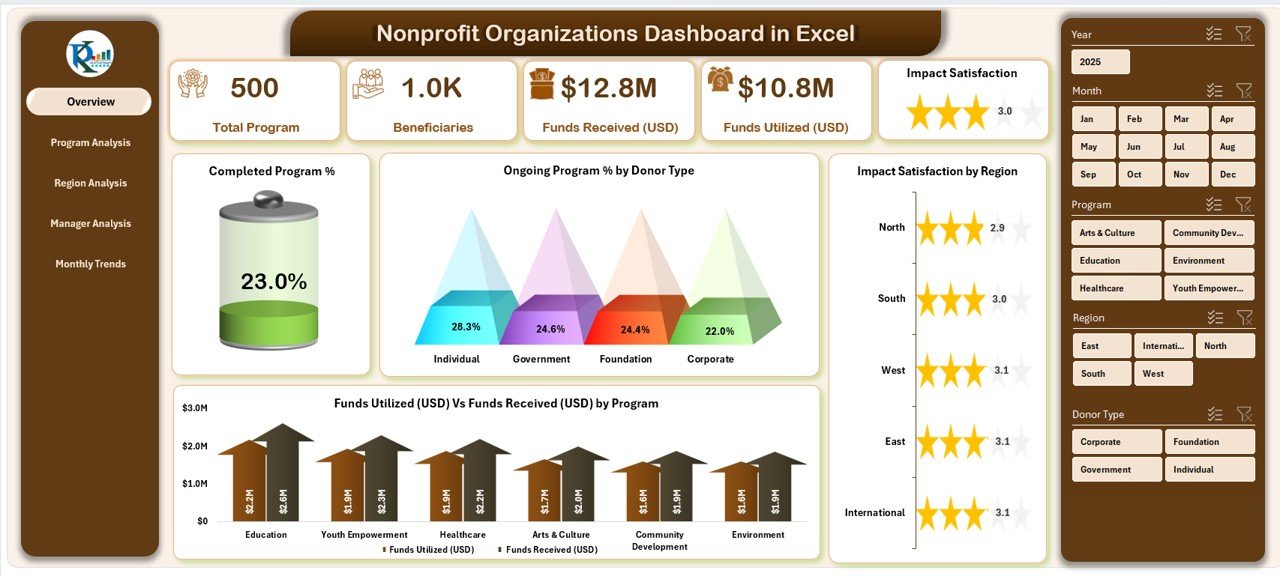
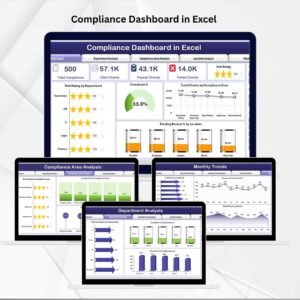
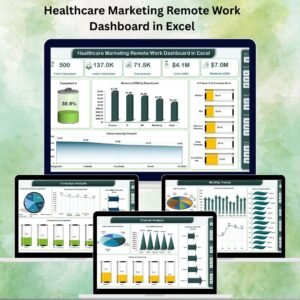
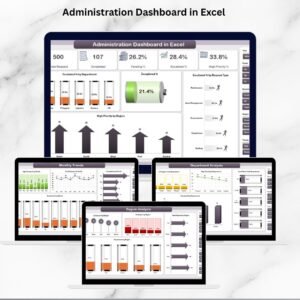
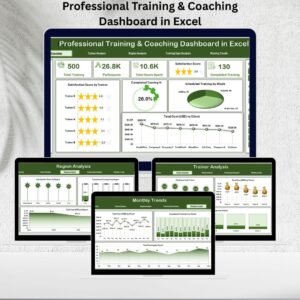
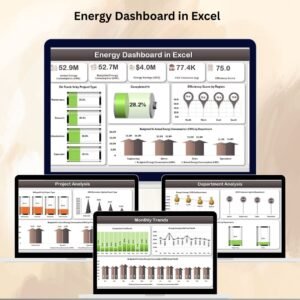
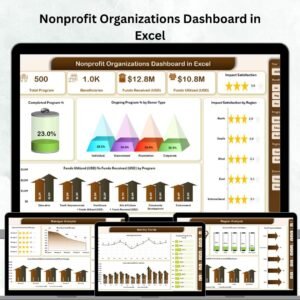
✅ Overview Page – 5 key cards plus charts showing completion rates, donor performance, and fund utilization.
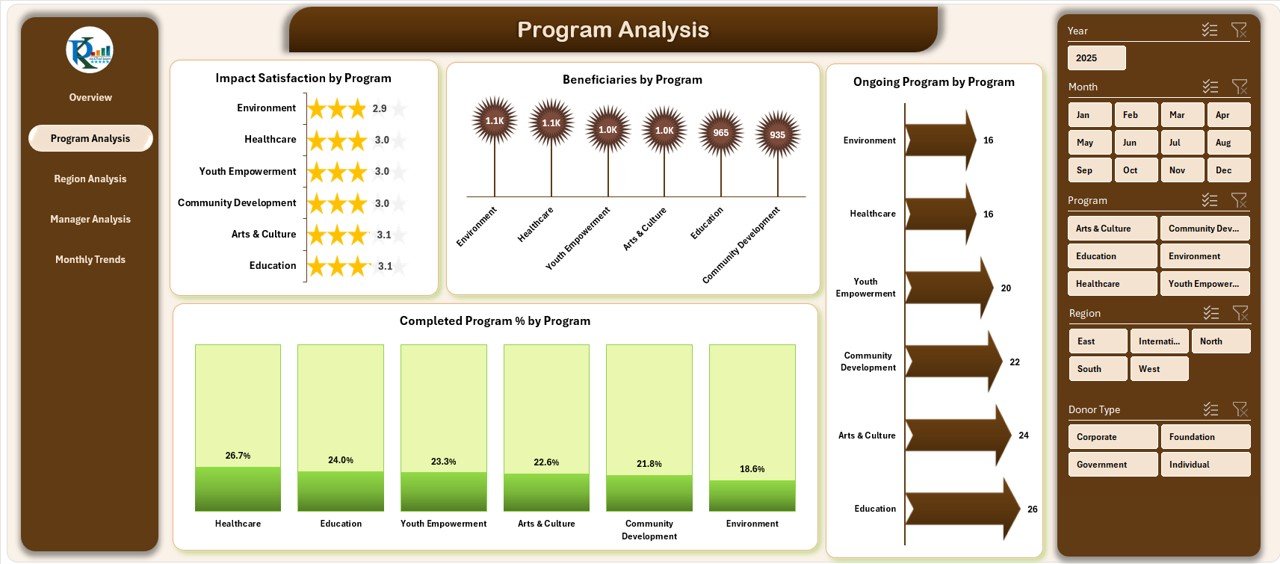
✅ Program Analysis – Drill into beneficiaries, completion %, and satisfaction by program.
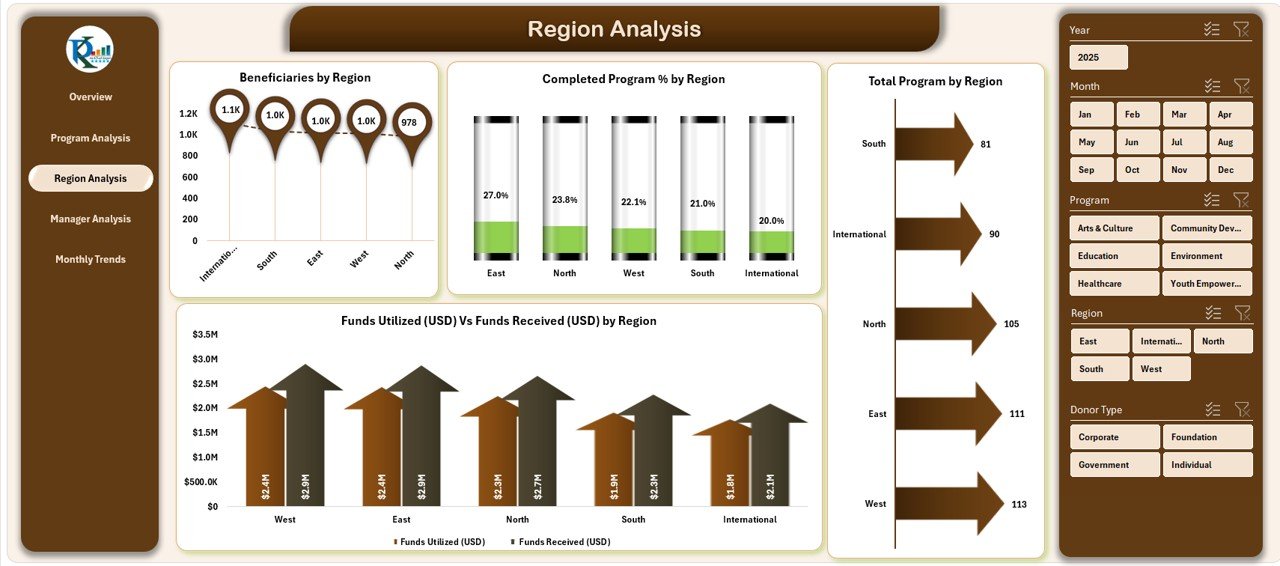
✅ Region Analysis – Identify performance gaps and opportunities across locations.
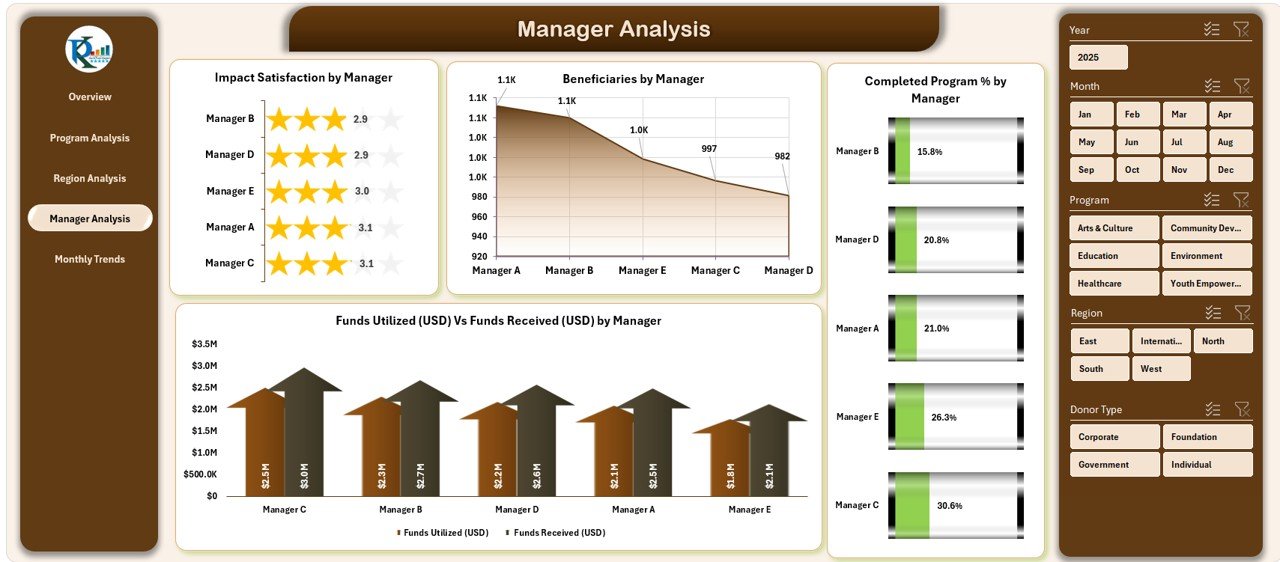
✅ Manager Analysis – Evaluate accountability and impact at the managerial level.
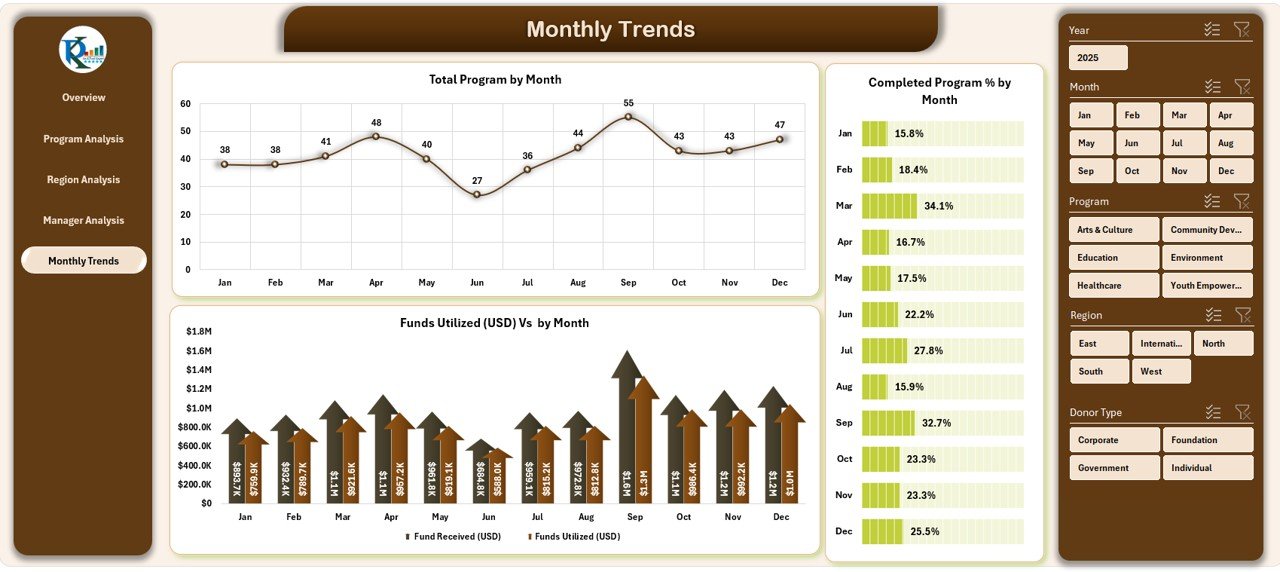
✅ Monthly Trends – Track growth and financials month by month.
✅ Interactive Slicers – Filter by donor type, region, or manager instantly.
✅ Real-Time Updates – Just refresh with new data for instant insights.
✅ Customizable KPIs – Add, remove, or adjust metrics to suit your nonprofit’s mission.
📂 What’s Inside the Nonprofit Dashboard
This template is organized into five detailed analytical sections:
-
Overview Page 📊 – A snapshot of organizational performance with cards and charts like Completed Program %, Ongoing Program % by Donor Type, Impact Satisfaction by Region, and Funds Utilized vs Funds Received.
-
Program Analysis Page 🎯 – Drill into program-specific KPIs such as Impact Satisfaction by Program and Beneficiaries by Program.
-
Region Analysis Page 🌍 – Compare beneficiaries, funds, and completion rates across multiple regions.
-
Manager Analysis Page 👤 – Review performance and accountability by manager, including fund utilization and impact.
-
Monthly Trends Page 📈 – Visualize month-by-month performance, highlighting program counts, completion %, and financial flows.
🛠️ How to Use the Nonprofit Organizations Dashboard
-
Input Data – Update program, fund, donor, and beneficiary details in the Data Sheet.
-
Navigate Pages – Use the Page Navigator to switch between Overview, Program, Region, Manager, and Trends.
-
Filter with Slicers – Refine views by region, donor type, or program manager.
-
Analyze KPIs – Use cards and charts to track completion, satisfaction, and fund efficiency.
-
Export Reports – Copy visuals into presentations or board reports for donors and stakeholders.
👥 Who Can Benefit from This Dashboard?
🌟 Nonprofit Directors – Present transparent data to boards and donors.
🌟 Program Managers – Track program-specific KPIs for better execution.
🌟 Regional Managers – Monitor performance across multiple areas.
🌟 Fundraising Teams – Show impact of donor contributions.
🌟 Small Nonprofits – Affordable, easy-to-use tool without advanced tech skills.
🌟 Large Organizations – Scalable to multiple programs, managers, and locations.


Reviews
There are no reviews yet.