


Managing music concerts and performing arts events is exciting, but tracking revenue, expenses, ticket sales, and venue performance can quickly become overwhelming. When data is scattered across multiple Excel sheets, decision-making slows down and critical insights get missed. That is exactly where the Music and Performing Arts Dashboard in Excel becomes a powerful game-changer.
This ready-to-use Excel dashboard is designed to convert raw event data into meaningful, visual insights. Instead of manually calculating numbers or preparing repetitive reports, you get a single interactive dashboard that shows revenue, expenses, profit, ticket sales, venue utilization, genre performance, and monthly trends. As a result, you save time, reduce errors, and make confident data-driven decisions.
Whether you manage concerts, theatre performances, dance shows, or cultural events, this dashboard gives you complete control over financial and operational performance—all inside Microsoft Excel.
🚀 Key Features of Music and Performing Arts Dashboard in Excel
🎶 Centralized Performance Tracking
Track all key event KPIs such as revenue, expenses, profit, tickets sold, and venue capacity from one dashboard.
📊 Interactive Overview Dashboard
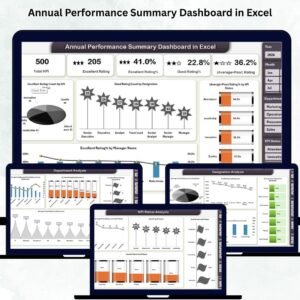
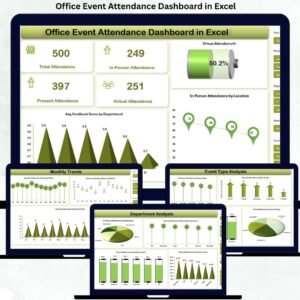
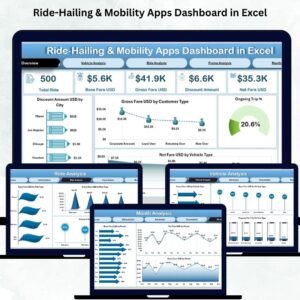
Instantly view Total Revenue, Total Expenses, Profit, Profit Margin (%), Tickets Sold, and Average Venue Capacity.
🎟️ Event Type Analysis
Analyze performance by event type with metrics like expenses, duration, profit margin, and venue capacity utilization.
🎭 Genre-Wise Insights
Identify top-performing genres based on ticket sales, expenses, and profit to optimize programming and marketing.
🏟️ Venue Utilization Analysis
Monitor occupancy rate, revenue, profit margin, and profitability by venue to improve venue selection and negotiations.
📅 Monthly Trend Analysis
Track artist ratings, profit margin trends, and ticket pricing patterns month by month for smarter planning.
⚡ Auto-Updating Dashboard
Update the Excel data tables, refresh, and all charts and KPIs update automatically.

📦 What’s Inside the Music and Performing Arts Dashboard in Excel
📊 Overview Sheet with KPI cards and summary charts
🎟️ Event Type Analysis Sheet for format-wise comparison
🎶 Genre Analysis Sheet to understand audience preferences
🏟️ Venue Utilization Sheet for occupancy and profitability insights
📅 Monthly Trends Sheet for time-based performance analysis
📁 Structured Data Tables for easy updates and scalability
Everything is pre-built, formatted, and ready to use—no complex setup required.
🧭 How to Use the Music and Performing Arts Dashboard in Excel
1️⃣ Enter or update your event data in the provided Excel data tables
2️⃣ Ensure data such as revenue, expenses, tickets sold, genres, and venues are updated
3️⃣ Refresh the dashboard (if required)
4️⃣ Instantly analyze KPIs, charts, and trends
5️⃣ Use insights to improve pricing, venue selection, and event planning
No advanced Excel skills are needed. Basic Excel knowledge is sufficient.
🎯 Who Can Benefit from This Music and Performing Arts Dashboard
🎵 Music concert organizers
🎭 Theatre and performing arts groups
🎶 Cultural institutions and art councils
🏟️ Venue managers and production houses
📊 Event management professionals
🎓 Arts and event management students
If you manage events and care about profitability, audience engagement, and performance clarity—this dashboard is built for you.
Click here to read the Detailed Blog Post
Watch the step-by-step video tutorial:
Visit our YouTube channel to learn step-by-step video tutorials


Reviews
There are no reviews yet.