

Mobile apps do not succeed just because users install them. True success depends on how users engage with the app—how often they return, how long they stay, and how actively they interact with features. Unfortunately, many teams track engagement data across multiple analytics tools, exports, and reports. As a result, insights become fragmented, slow, and difficult to act upon.Mobile App Engagement KPI Dashboard in Google Sheets
That is exactly why a Mobile App Engagement KPI Dashboard in Google Sheets becomes a powerful and practical solution.
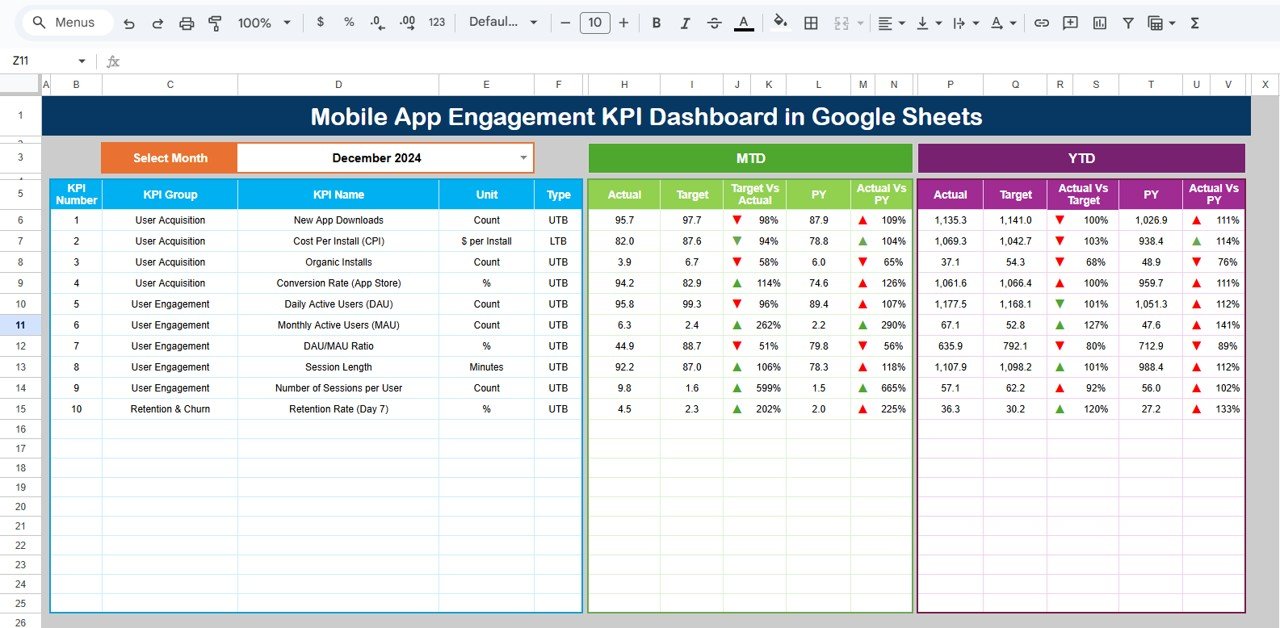
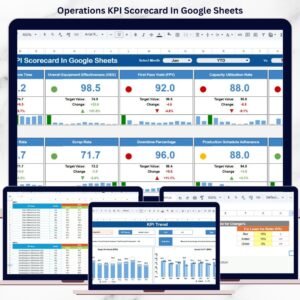
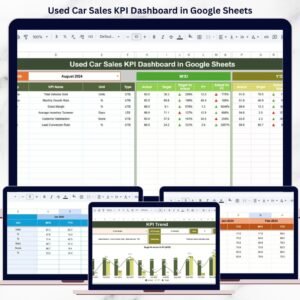
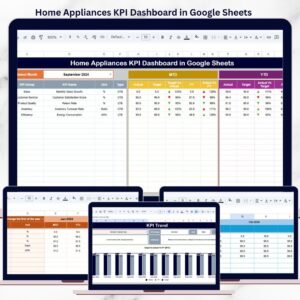
This ready-to-use dashboard centralizes all critical mobile app engagement metrics into one structured Google Sheets file. Instead of switching between platforms, teams can track performance using clear KPIs, automated calculations, and visual indicators. Most importantly, it supports Month-to-Date (MTD), Year-to-Date (YTD), Target vs Actual, and Previous Year comparisons, helping teams make confident, data-driven decisions.
Because the dashboard is built in Google Sheets, it is flexible, collaborative, and easy to maintain—without expensive BI tools or technical complexity.
🚀 Key Features of Mobile App Engagement KPI Dashboard
📊 MTD & YTD Engagement Tracking
Track short-term and long-term user engagement trends clearly.
🎯 Target vs Actual Comparison
Instantly see whether engagement KPIs are meeting expectations.
📈 Previous Year Benchmarking
Understand growth patterns and seasonal engagement behavior.
🔔 Visual Performance Indicators
Up and down arrows highlight improvement or decline instantly.
🔍 Dedicated KPI Trend Analysis
Analyze individual engagement KPIs month by month.
🤝 Real-Time Collaboration
Multiple stakeholders can update and review data simultaneously.
📦 What’s Inside the Mobile App Engagement KPI Dashboard
🧾 Dashboard Sheet Tab – Main Performance View
This is the executive overview used for reviews and reporting.
📅 Month Selector
-
Select the month from Cell D3
-
All KPIs update automatically
📊 MTD Metrics Displayed
-
MTD Actual
-
MTD Target
-
MTD Previous Year
-
Target vs Actual
-
Previous Year vs Actual
📈 YTD Metrics Displayed
-
YTD Actual
-
YTD Target
-
YTD Previous Year
-
Target vs Actual
-
Previous Year vs Actual
Conditional formatting with arrows makes performance interpretation instant.
📉 KPI Trend Sheet – Deep KPI Analysis
🔎 How It Works
-
Select a KPI from the dropdown in Cell C3
-
The sheet updates dynamically
📋 KPI Details Displayed
-
KPI Group
-
KPI Unit
-
KPI Type (Upper the Better / Lower the Better)
-
KPI Formula
-
KPI Definition
This sheet ensures clarity and consistency across teams.
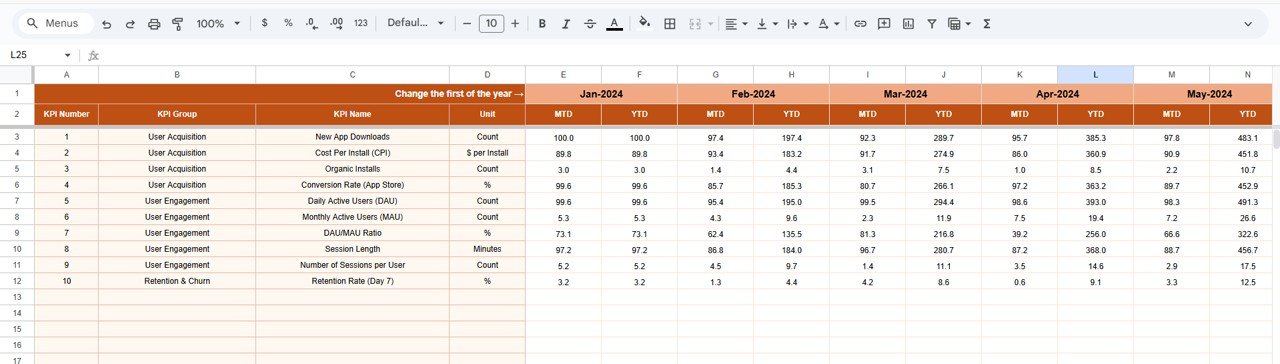
🧮 Actual Number Sheet Tab
This sheet is used for entering real engagement data.
🛠️ How to Use
-
Select the first month of the year in Cell E1
-
Enter MTD Actual and YTD Actual values
-
Dashboard updates automatically
This structured approach minimizes errors and saves time.
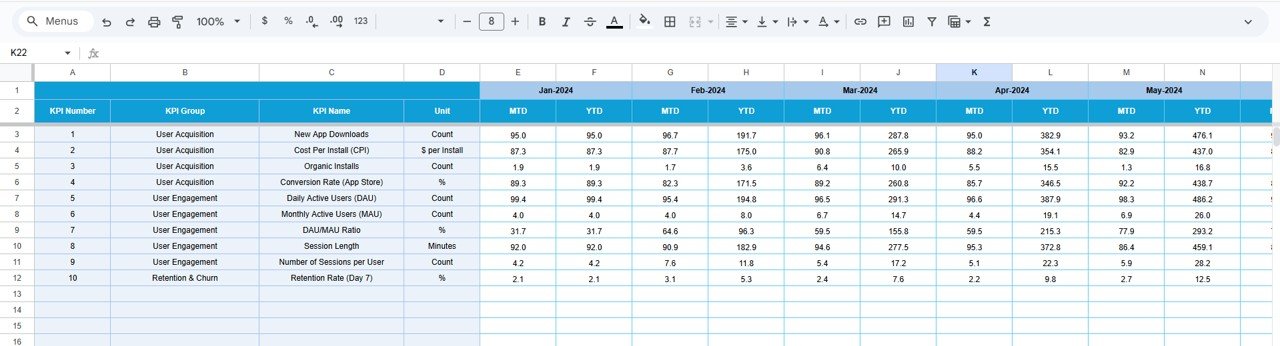
🎯 Target Sheet Tab
The Target Sheet defines expected engagement goals.
✍️ Targets Tracked
-
Monthly MTD Targets
-
Cumulative YTD Targets
Targets help align engagement strategy with business goals.
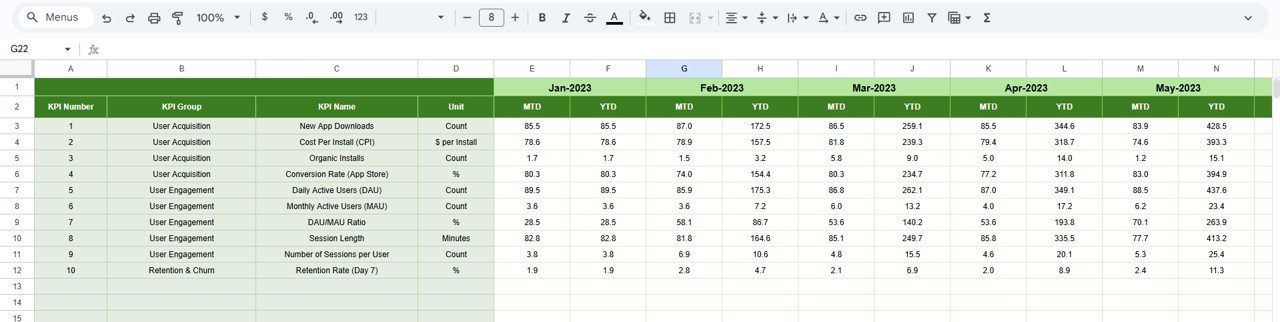
📆 Previous Year Number Sheet Tab
This sheet stores historical engagement data.
📊 Purpose
-
Year-over-year comparison
-
Engagement trend benchmarking
-
Performance improvement analysis
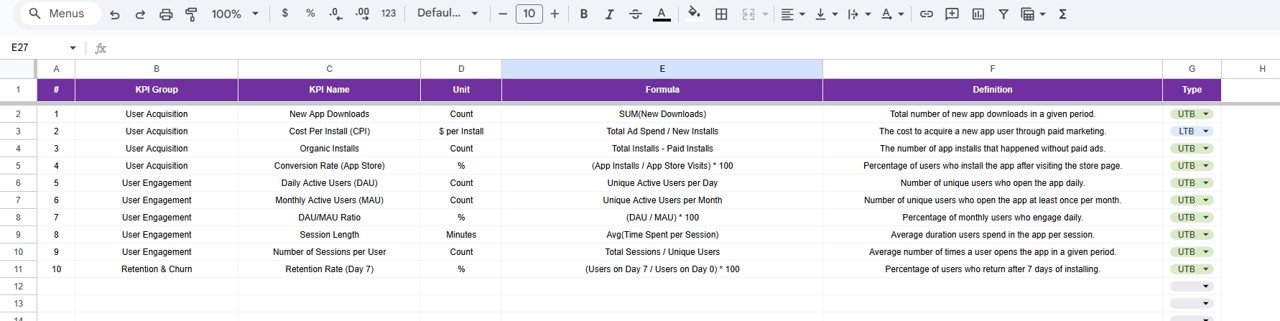
📚 KPI Definition Sheet Tab
This is the KPI control and governance sheet.
🧾 Fields Included
-
KPI Name
-
KPI Group
-
Unit
-
Formula
-
KPI Definition
-
KPI Type (UTB / LTB)
This ensures KPI transparency and audit readiness.
🎯 Who Can Benefit from This Dashboard
-
📱 Mobile App Product Managers
-
🚀 Growth & Marketing Teams
-
📊 Data & Analytics Teams
-
💼 Startup Founders & Leadership
-
🧠 UX & Engagement Strategists
🛠️ How to Use the Mobile App Engagement KPI Dashboard
-
Update engagement data regularly
-
Review MTD and YTD KPIs weekly
-
Compare Actual vs Target consistently
-
Analyze trends, not just single months
-
Use insights for product and growth planning
🔗 Click here to read the Detailed blog post
Watch the step-by-step video tutorial:


Reviews
There are no reviews yet.