


Managing key performance indicators (KPIs) in the medical device industry can be challenging—especially when your data is scattered, your reports are slow, and your insights aren’t clear. That’s why we created the Medical Device KPI Dashboard in Power BI, a plug-and-play solution built for tracking, analyzing, and visualizing performance data across departments and timelines 🧠📊.
Designed to help manufacturers, quality managers, and executives streamline reporting and decision-making, this powerful dashboard converts raw Excel data into insightful charts, comparisons, and performance indicators—all in real-time.
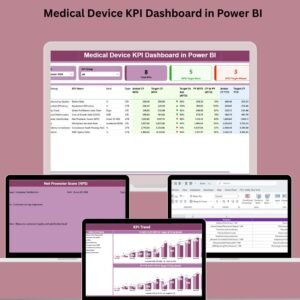
💡 Key Features of Medical Device KPI Dashboard in Power BI
🗂️ All-in-One Summary Page

Track your overall KPI performance using slicers and visual indicators for:
-
✅ Total KPI Count
-
✅ MTD Target Met
-
❌ MTD Target Missed
Get a quick view with performance icons (▲ for target met, ▼ for missed) and year-over-year comparisons.
📊 Detailed KPI Table
View a comprehensive list of each KPI with details like:
-
KPI Name, Group, Unit
-
Type (UTB/LTB)
-
MTD & YTD: Actual vs. Target
-
Icons & % comparisons to previous year
📈 KPI Trend Page
Visualize MTD and YTD performance trends over time. Compare this year, last year, and target values with interactive combo charts.
📘 KPI Definition Page
Easily access definitions, formulas, units, and descriptions via drill-through from the Summary page. Perfect for audits and internal clarity.
🔄 Excel-Integrated Data Input
Update your KPI actual and target data from Excel with ease. Just refresh in Power BI to see updated visuals.
📦 What’s Inside the Medical Device KPI Dashboard?
🏠 Summary Page
Your performance command center. Monitor counts, spot performance trends, and slice the data by month and KPI group.
📈 KPI Trend Page
Analyze growth patterns and fluctuations with combo charts. Select any KPI and drill into its MTD/YTD performance across time.
📖 KPI Definition Page
Accessible through drill-through, this page outlines formulas, descriptions, and the logic behind each KPI.
📂 Excel Input Sheets
Easily maintain your MTD and YTD data in Excel, then refresh Power BI to sync the dashboard.
🛠️ How to Use the Medical Device KPI Dashboard
-
Update Your Excel Files – Input current Actual and Target MTD/YTD numbers.
-
Refresh the Power BI Dashboard – One-click update reflects all changes in visuals.
-
Use Filters & Slicers – Narrow down by month or KPI group for focused insights.
-
Review Icons & Trends – Instantly see whether KPIs are being met and how they’ve evolved.
-
Drill into Definitions – Understand every KPI using the detailed definition page.
No Power BI expertise required. If you know how to use slicers and filters, you’re ready to go!
👥 Who Can Benefit from This Dashboard?
🏭 Medical Device Manufacturers – Monitor performance, quality, and compliance
🧪 QA/QC Teams – Track test metrics and failure rates
📊 Operations Leaders – Optimize supply chain, production output, and workforce KPIs
📈 Sales Teams – Analyze sales goals, conversions, and trends
💼 Executives and Managers – View summarized reports for strategic decisions
🔬 R&D and Regulatory Teams – Stay audit-ready with well-defined KPIs
Whether you’re managing a product line or overseeing global operations, this dashboard empowers smarter decisions.
🔗 Click here to read the Detailed blog post
📺 Visit our YouTube channel to learn step-by-step video tutorials


Reviews
There are no reviews yet.