Marketing budgets are growing fast—but are your campaigns actually making money? Many marketing teams still rely on guesswork, scattered spreadsheets, and delayed reports. The result? Overspending, low ROI, and missed opportunities.Marketing ROI Dashboard in Excel
✨ That’s exactly why the Marketing ROI Dashboard in Excel is a game-changer.
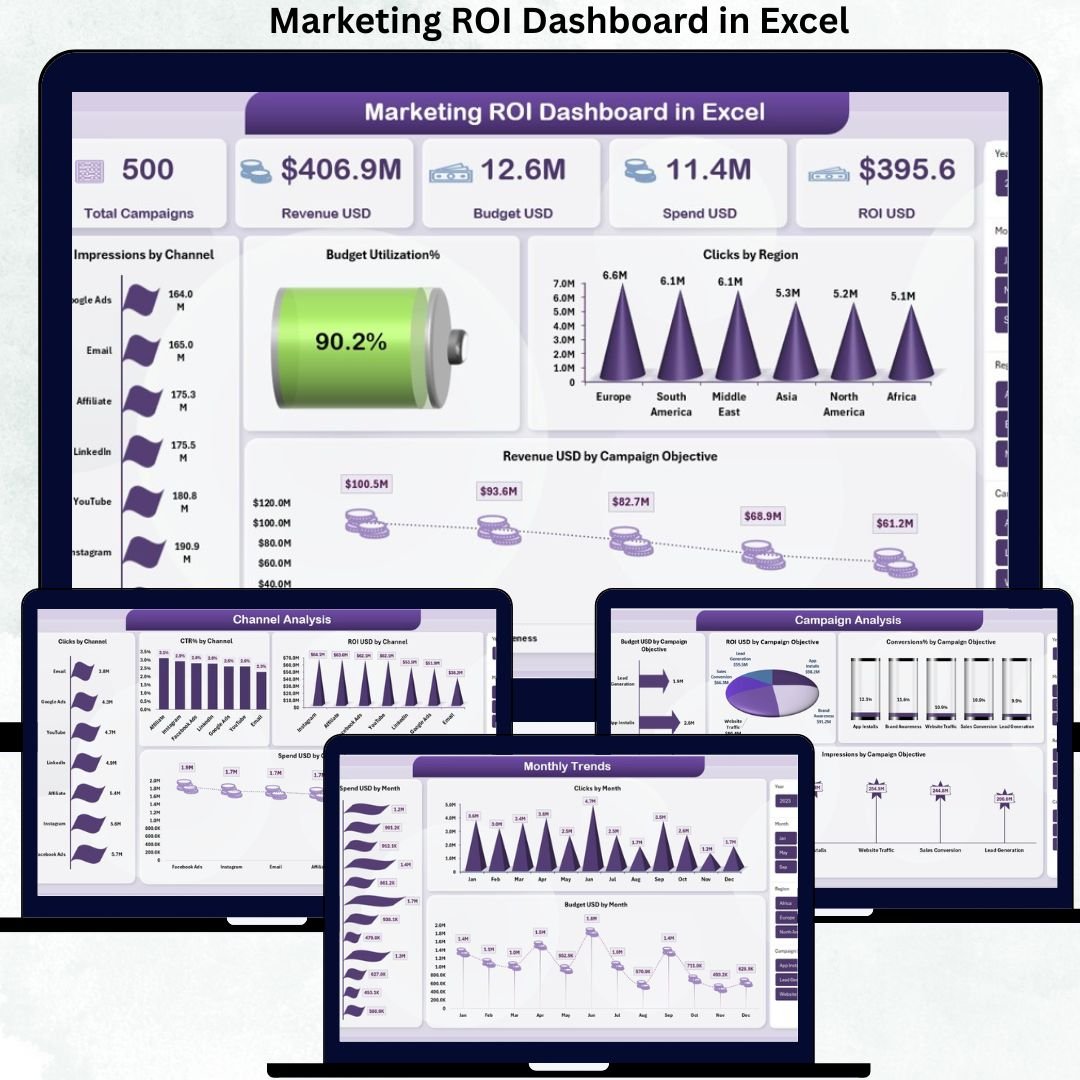
This ready-to-use Excel dashboard transforms raw marketing data into clear, actionable insights. It helps you track revenue, budget, spend, ROI, channels, regions, campaigns, and monthly trends—all in one powerful Excel file.
No Power BI. No complex tools. Just smart Excel analytics that drive smarter marketing decisions.
🚀 Key Features of Marketing ROI Dashboard in Excel
✅ All-in-One Marketing Performance View
Monitor revenue, spend, budget utilization, and ROI from a single interactive dashboard.
✅ Executive-Friendly Overview Page
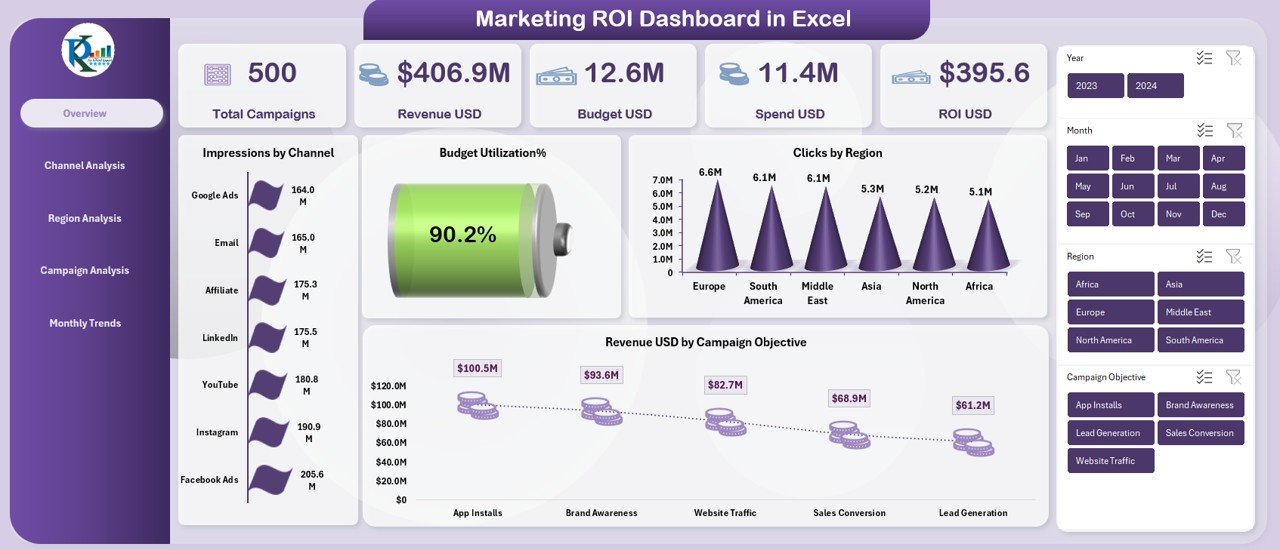
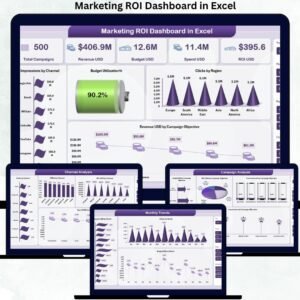
Get instant visibility with KPI cards for Total Campaigns, Revenue USD, Budget USD, Spend USD, ROI USD, and Budget Utilization %.
✅ Channel-Wise ROI Analysis
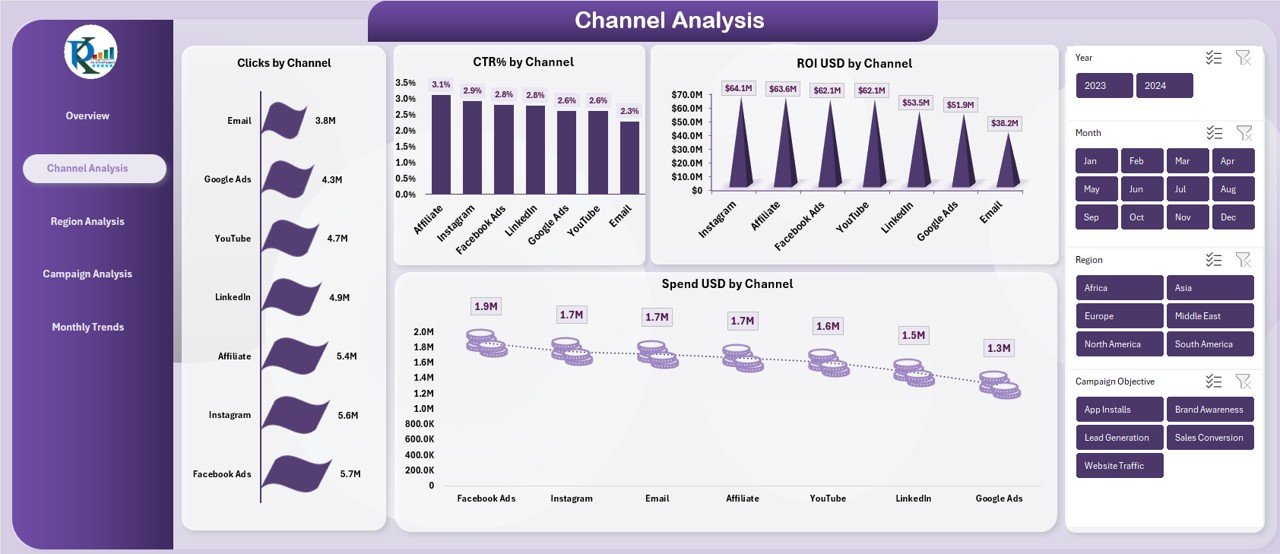
Identify which marketing channels deliver high clicks, strong CTR, and maximum ROI—and which ones drain your budget.
✅ Region-Based Performance Tracking
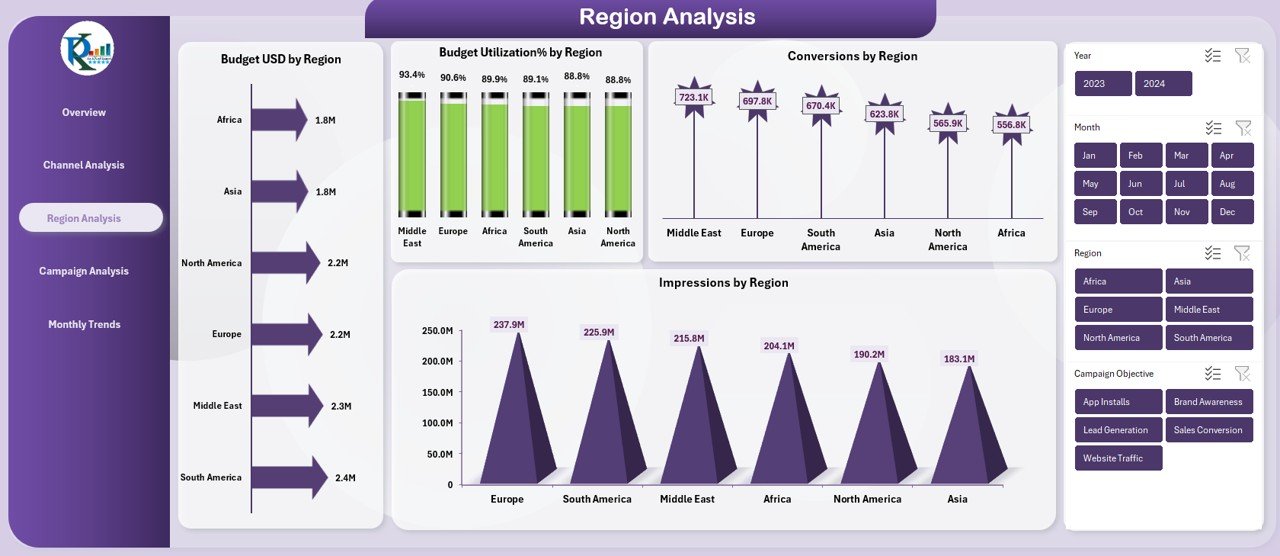
Analyze impressions, conversions, and budget usage across regions to spot high-growth markets.
✅ Campaign Objective Comparison
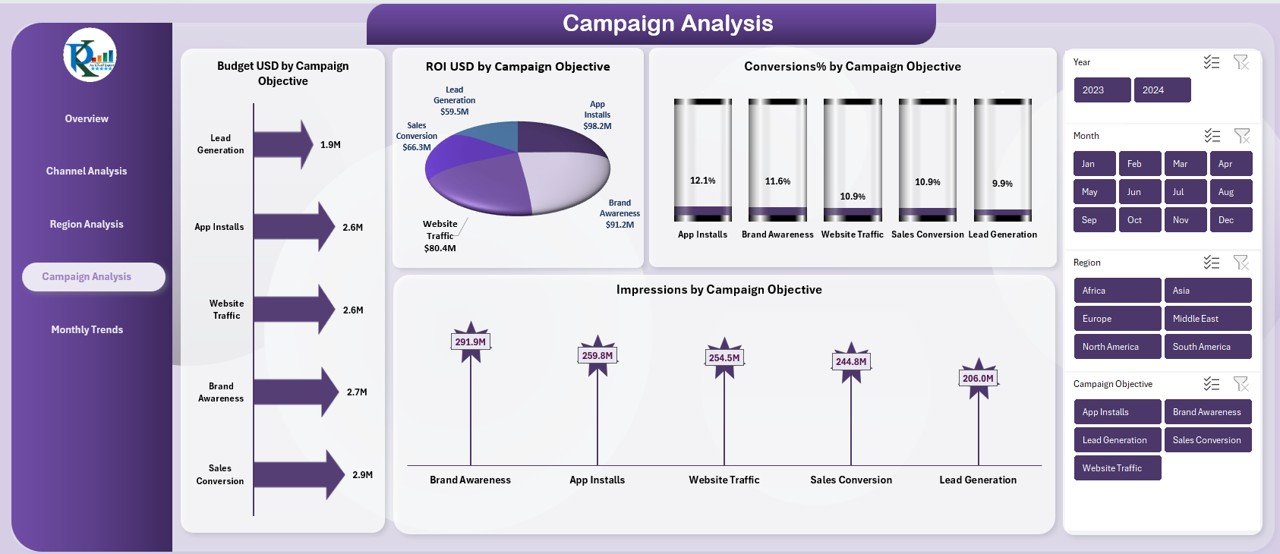
Understand which campaign goals generate real results using objective-level ROI and conversion insights.
✅ Monthly Trend Analysis
Track spend, clicks, and budget month-by-month to identify seasonality and optimize future planning.
✅ 100% Excel-Based & Customizable
Add new campaigns, regions, or channels easily—no advanced technical skills needed.
📂 What’s Inside the Marketing ROI Dashboard in Excel
📌 Overview Sheet
High-level snapshot with KPI cards and charts:
-
Impressions by Channel
-
Clicks by Region
-
Revenue USD by Campaign Objective
📌 Channel Analysis Sheet
Deep dive into channel performance:
-
Clicks by Channel
-
CTR % by Channel
-
Spend USD & ROI USD by Channel
📌 Region Analysis Sheet
Geographic insights with:
-
Budget USD & Budget Utilization % by Region
-
Impressions & Conversions by Region
📌 Campaign Analysis Sheet
Objective-level clarity through:
-
Budget USD, Impressions, Conversions %, and ROI USD by Campaign Objective
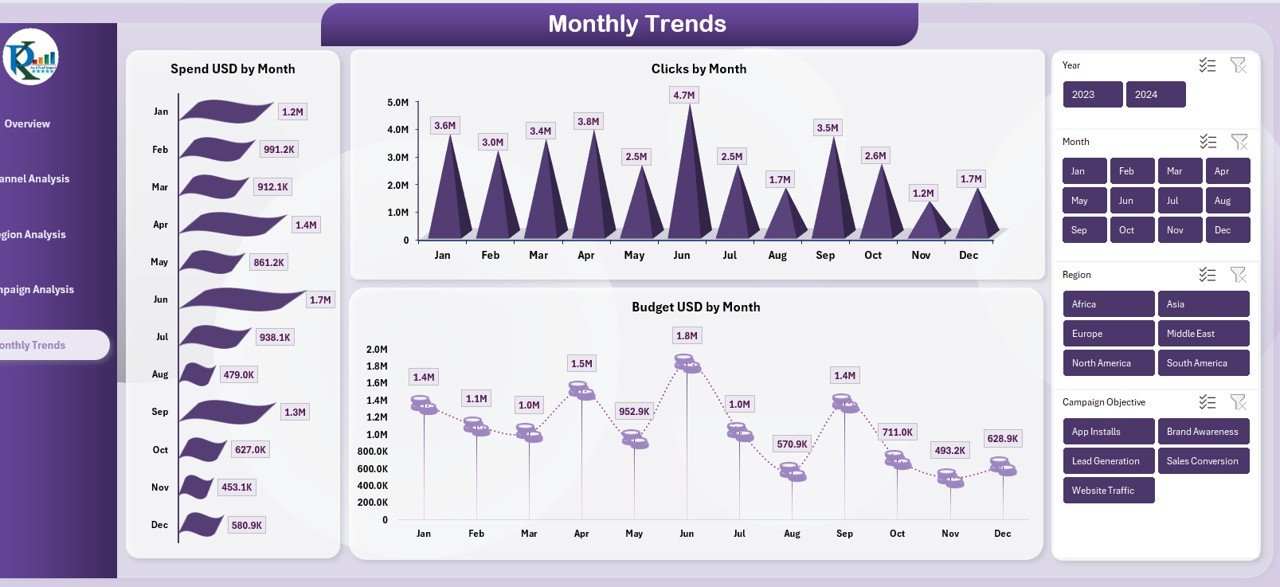
📌 Monthly Trends Sheet
Time-based performance tracking:
-
Spend USD by Month
-
Clicks by Month
-
Budget USD by Month
🛠️ How to Use the Marketing ROI Dashboard in Excel
1️⃣ Enter or update your campaign data in the dataset sheet
2️⃣ Review the Overview Sheet for instant performance insights
3️⃣ Analyze channels and regions to identify winners and losers
4️⃣ Compare campaign objectives to refine strategy
5️⃣ Use monthly trends to forecast and plan future campaigns
📈 With this workflow, marketing decisions become faster, smarter, and data-driven.
🎯 Who Can Benefit from This Marketing ROI Dashboard?
✅ Marketing Managers – Track ROI and control budgets
✅ Digital Marketers – Optimize campaigns and channels
✅ Business Owners & Founders – Understand marketing profitability
✅ Marketing Analysts – Generate insights and reports faster
✅ Startups & SMEs – Get enterprise-level analytics at low cost
Whether you manage 5 campaigns or 500, this dashboard adapts to your needs.


Reviews
There are no reviews yet.