In today’s fast-moving business environment, Knowledge Sharing and Collaboration Dashboard. However, many organizations still rely on emails, disconnected tools, and scattered spreadsheets to manage training sessions and collaboration activities. As a result, valuable insights get lost. Moreover, managers struggle to measure performance. Consequently, decisions become slow and unclear.
Now imagine tracking Total Sessions, Knowledge Rating, Satisfaction Score, Collaboration Score, Session Duration, Cost, Department Performance, and Monthly Trends — all in one structured Excel dashboard.
That is exactly what the Knowledge Sharing and Collaboration Dashboard in Excel delivers.
This ready-to-use dashboard transforms raw session data into powerful visual insights using KPI cards, pivot charts, and interactive slicers. As a result, leaders gain clarity and teams improve performance.
Stop assuming collaboration works. Start measuring it.
🚀 Key Features of Knowledge Sharing and Collaboration Dashboard in Excel
📊 5 Fully Designed Analytical Pages
🧭 Easy Page Navigator
🎯 KPI Cards for Instant Summary
🔎 Right-Side Slicers for Dynamic Filtering
📈 Department & Knowledge Type Analysis
📅 Month-Wise Trend Monitoring
💰 Session Cost Tracking
🛠 Customizable Structure
📂 Clean Data & Support Sheets
Because it runs entirely in Excel, you do not need expensive tools or complex software.
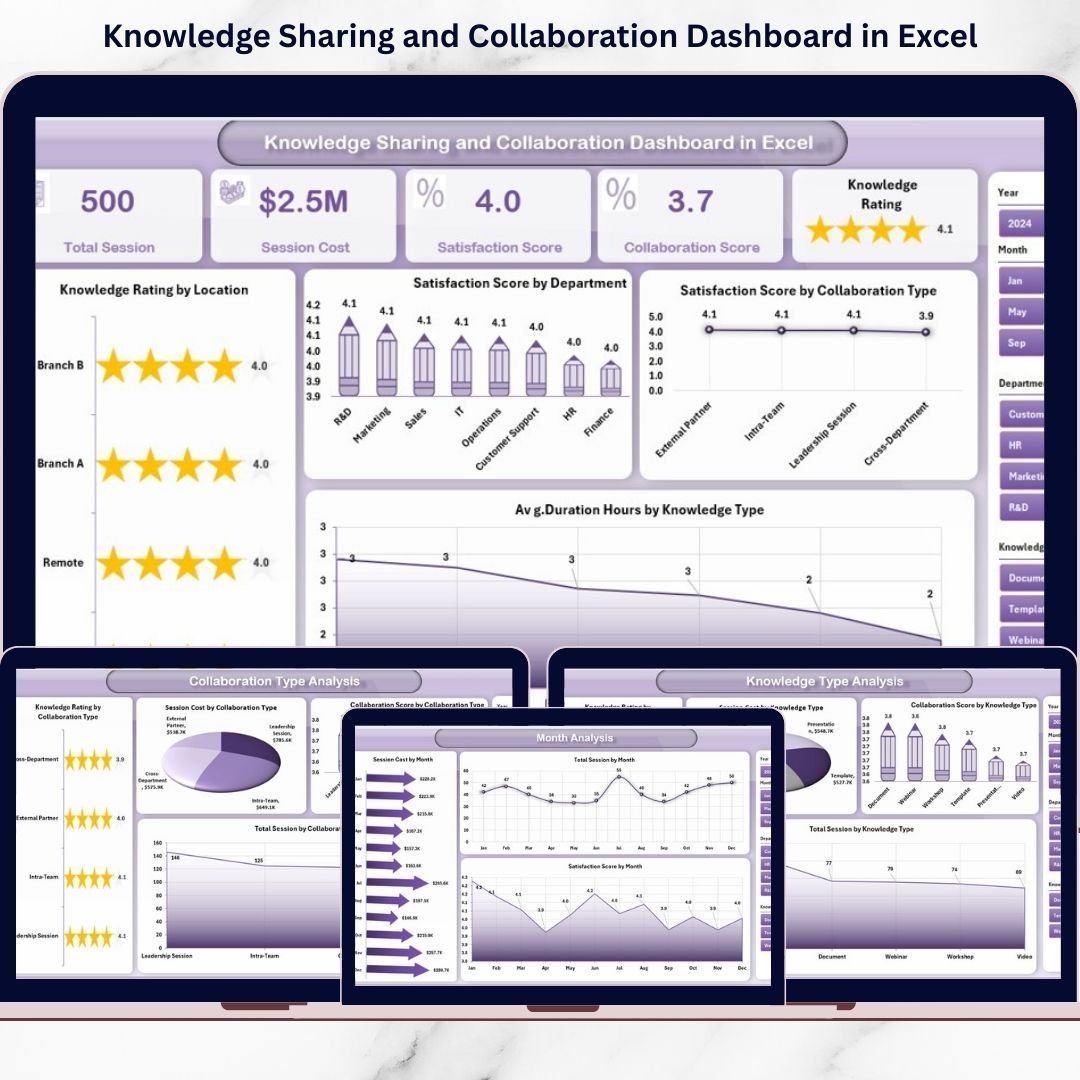
📦 What’s Inside the Knowledge Sharing and Collaboration Dashboard in Excel
This dashboard includes five powerful analytical pages, each designed to measure collaboration performance clearly.
1️⃣ Overview Page – Strategic Snapshot
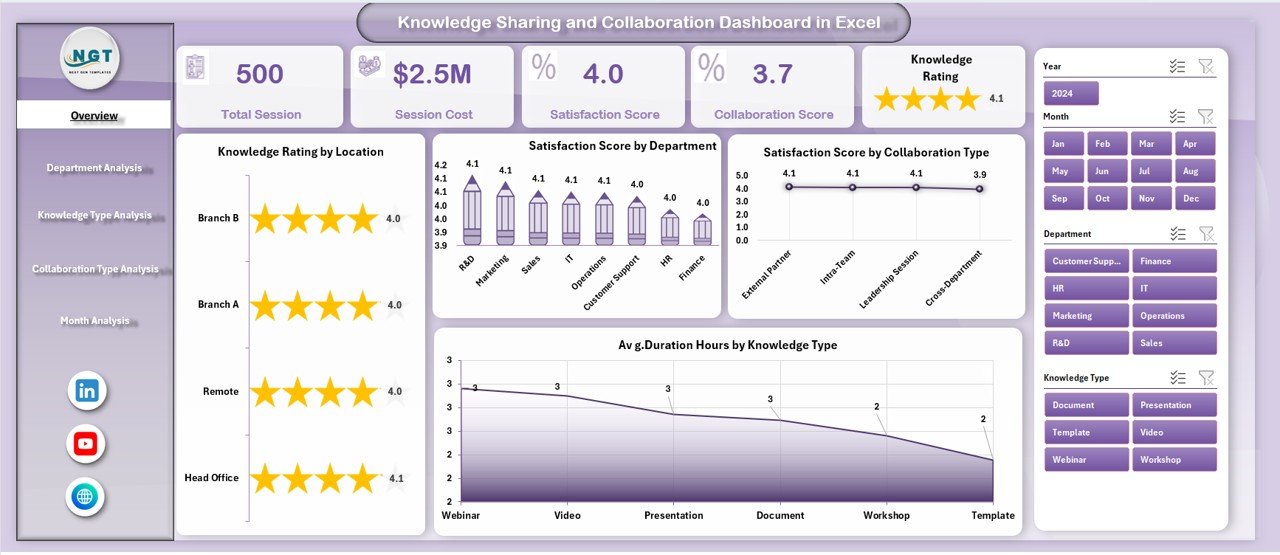
The Overview page acts as the control center.
KPI Cards include:
-
Total Sessions
-
Average Knowledge Rating
-
Average Satisfaction Score
-
Average Duration (Hours)
Charts display:
-
Knowledge Rating by Location
-
Satisfaction Score by Department
-
Satisfaction Score by Collaboration Type
-
Average Duration by Knowledge Type
With right-side slicers, managers can filter departments, locations, or knowledge types instantly.
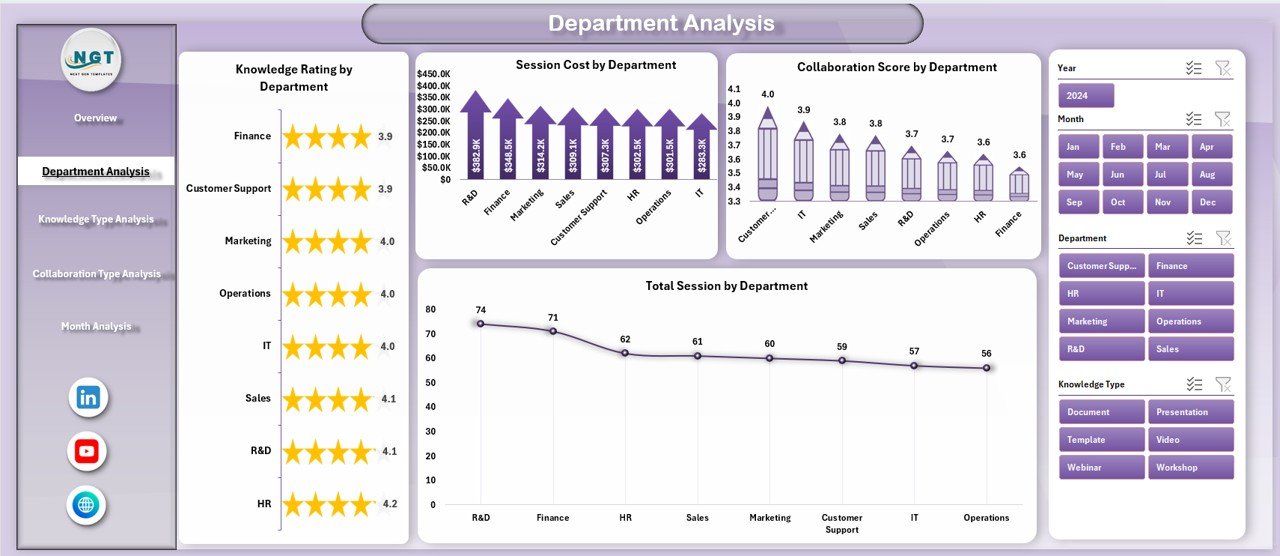
2️⃣ Department Analysis – Team-Level Performance
This page compares department performance.
Track:
-
Knowledge Rating by Department
-
Total Sessions by Department
-
Satisfaction Score by Department Type
-
Collaboration Score by Department
Identify which departments actively contribute and which require improvement.
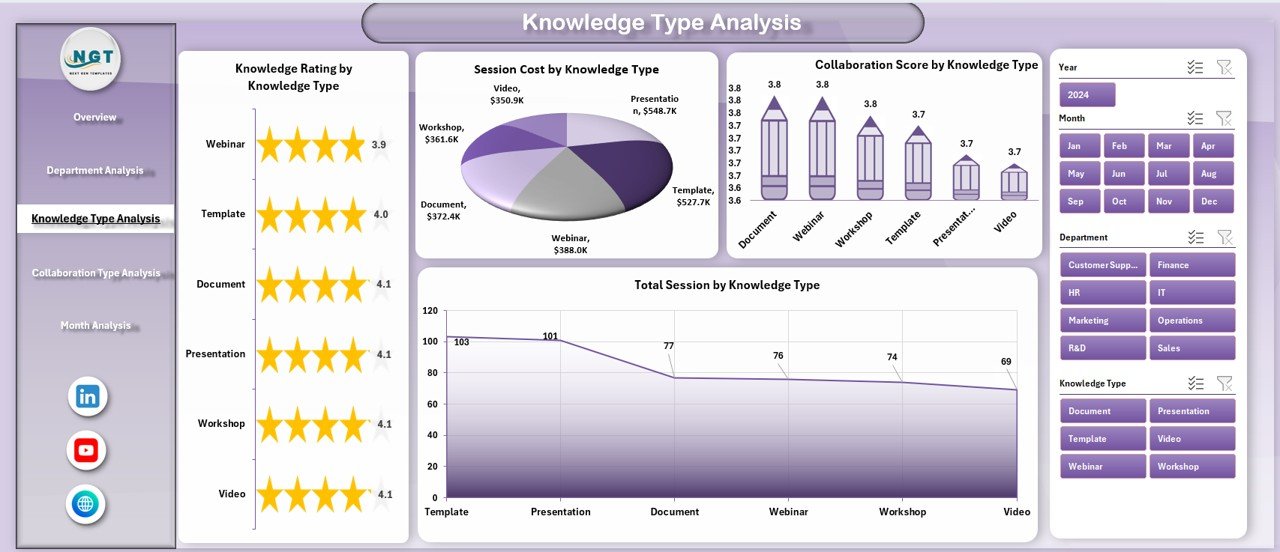
3️⃣ Knowledge Type Analysis – Training Effectiveness
Different knowledge types deliver different impact.
Analyze:
-
Knowledge Rating by Knowledge Type
-
Total Sessions by Knowledge Type
-
Satisfaction Score by Knowledge Type
-
Collaboration Score by Knowledge Type
Focus on high-impact knowledge areas and improve weak ones.
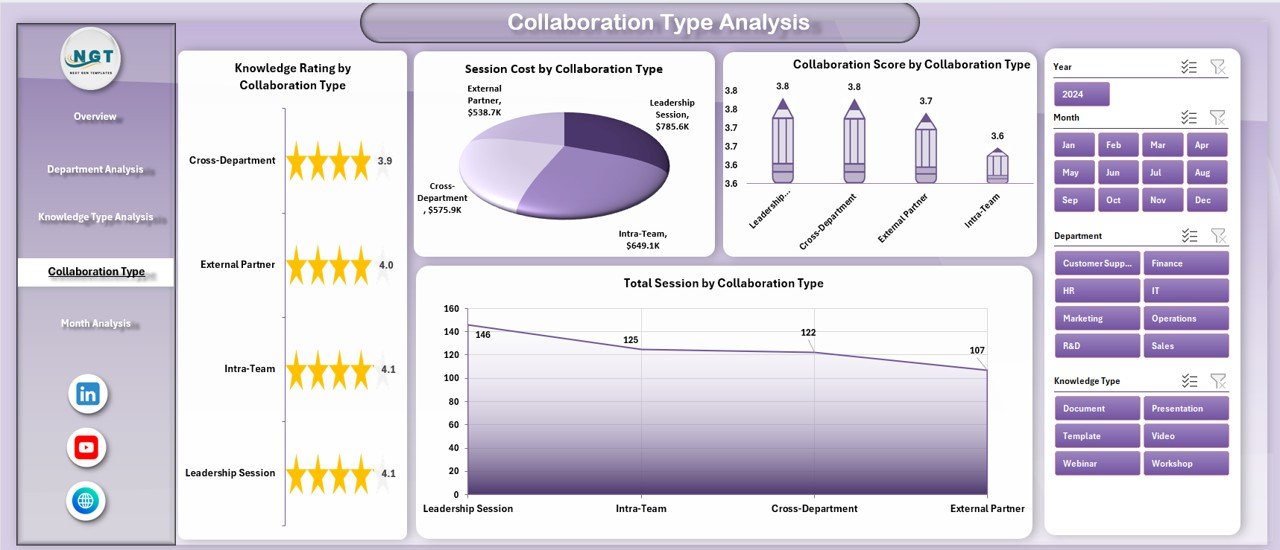
4️⃣ Collaboration Type Analysis – Best Engagement Format
Evaluate collaboration methods such as:
-
Workshops
-
Webinars
-
Team Meetings
-
One-on-One Sessions
-
Cross-Functional Projects
Track performance across:
-
Knowledge Rating
-
Satisfaction Score
-
Collaboration Score
-
Total Sessions
Discover which collaboration format drives the best results.
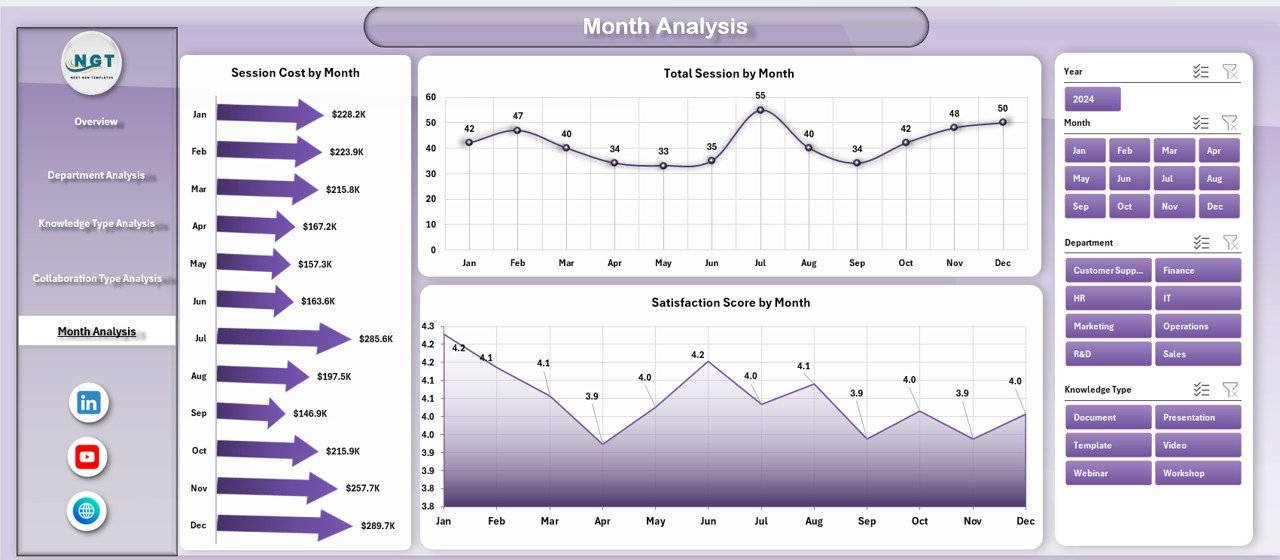
5️⃣ Month Analysis – Performance Trends
Monthly tracking reveals trends.
Monitor:
-
Session Cost by Month
-
Total Sessions by Month
-
Satisfaction Score by Month
Identify seasonal patterns, budget usage, and engagement improvement.
🛠 How to Use the Knowledge Sharing and Collaboration Dashboard in Excel
Using this dashboard is simple:
1️⃣ Enter session-level data in the Data Sheet
2️⃣ Maintain dropdown values in the Support Sheet
3️⃣ Refresh pivot tables
4️⃣ Use slicers to filter analysis
No advanced Excel knowledge required. The system is structured and user-friendly.
👥 Who Can Benefit from This Knowledge Sharing and Collaboration Dashboard in Excel
🏢 HR Departments
📚 Learning & Development Teams
👩💼 Corporate Trainers
📊 Business Leaders
🏭 Department Managers
🎓 Training Coordinators
Whether you run internal training programs or cross-functional collaboration initiatives, this dashboard supports structured monitoring.
By using this dashboard, you:
✔ Measure training effectiveness
✔ Track department participation
✔ Monitor satisfaction and engagement
✔ Optimize collaboration formats
✔ Control training budgets
✔ Improve knowledge-sharing culture
✔ Support data-driven leadership
Instead of relying on assumptions, you gain measurable insights.
This is not just an Excel file. It is a structured collaboration performance management system.
If you want stronger teamwork, higher engagement, and measurable knowledge impact — this dashboard gives you the control you need.