In the luxury retail industry, every detail matters — from design excellence to customer experience. To maintain precision, performance, and profitability, tracking the right metrics is essential. That’s where the Jewellery and Watches KPI Dashboard in Excel 💎✨ becomes your secret weapon.
This powerful Excel-based analytics tool helps jewellery and watch retailers monitor key performance indicators (KPIs) across sales, inventory, marketing, and customer satisfaction — all in one elegant, easy-to-use dashboard. Whether you manage a single boutique or multiple luxury stores, this dashboard turns raw data into meaningful insights that drive smarter decisions and higher profits.
💫 Key Features of Jewellery and Watches KPI Dashboard in Excel
✅ Interactive Dashboard View: Switch seamlessly between Month-to-Date (MTD) and Year-to-Date (YTD) views for quick analysis.
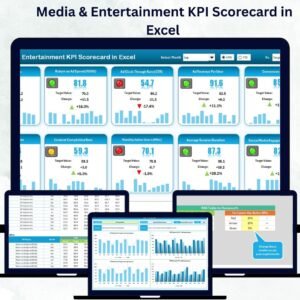
✅ Smart Dropdown Selection: Choose any month from a dropdown — all figures and visuals update automatically.
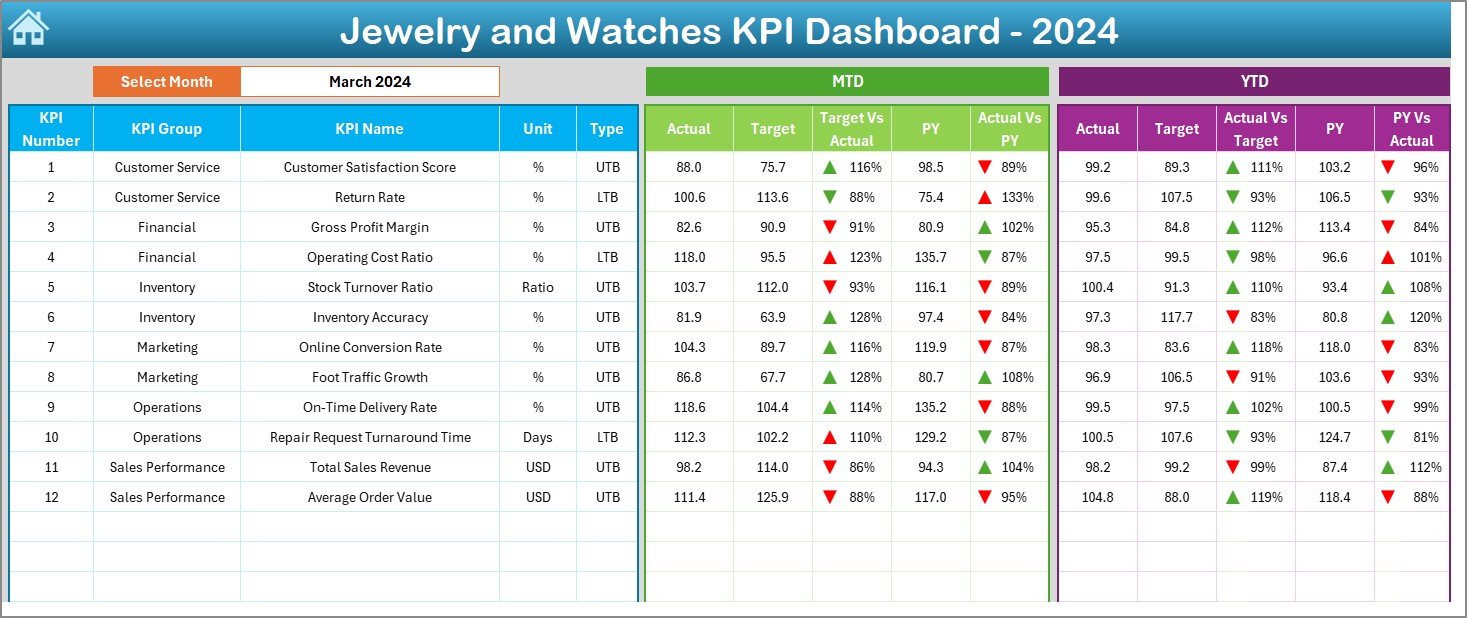
✅ Target vs Actual Comparison: Instantly see which KPIs exceed or fall below expectations.
✅ Visual Indicators: Arrows 🔼🔽 and color coding (green/yellow/red) make performance easy to interpret.
✅ Automated Calculations: Built-in formulas calculate trends, eliminating manual effort.
✅ Data Accuracy & Consistency: Centralized data structure ensures reliable, up-to-date metrics.
✅ Customizable Layout: Add or edit KPIs to fit your unique retail strategy.
✅ Cost-Effective Solution: Get business-intelligence-level insights with Excel — no extra software needed!
From sales associates to senior management, everyone can easily understand the data and take immediate, informed action.
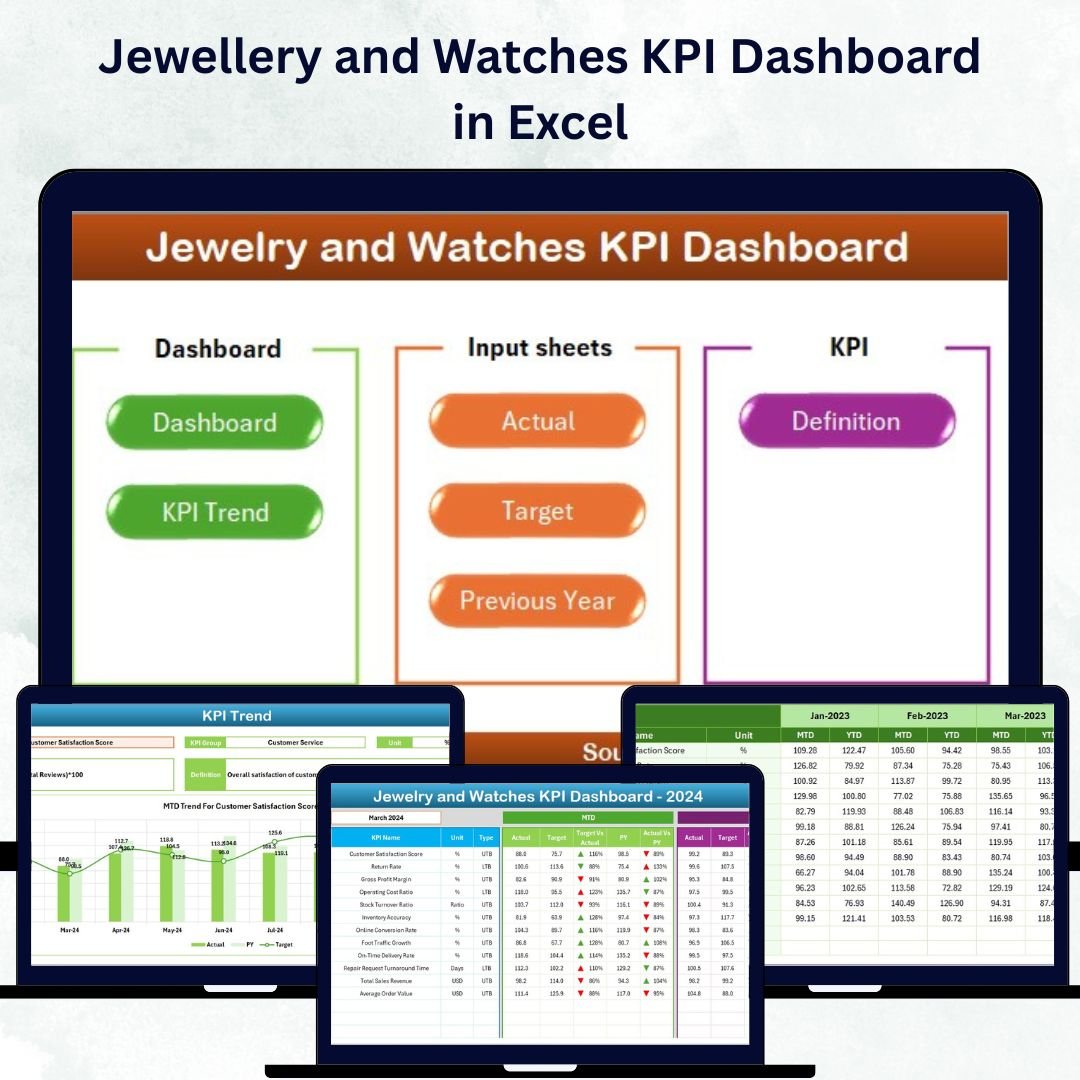
📂 What’s Inside the Jewellery and Watches KPI Dashboard in Excel
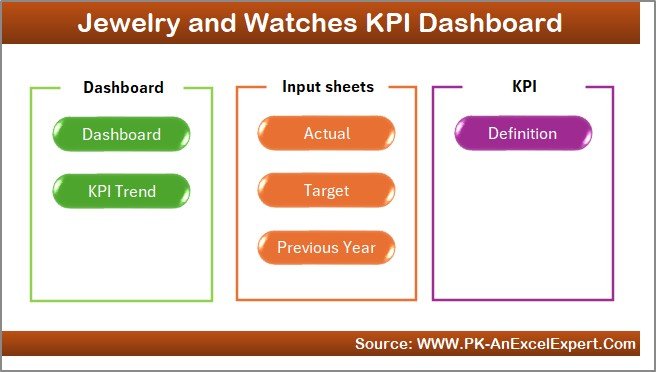
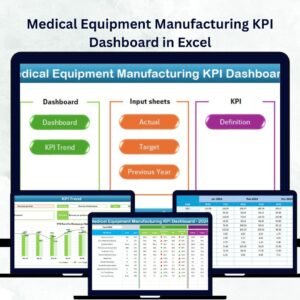
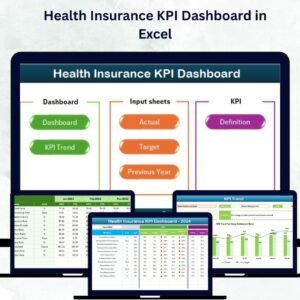
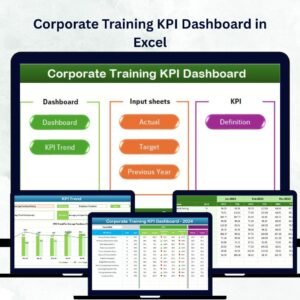
The template includes seven beautifully designed worksheets; each tailored for specific business functions:
1️⃣ Home Sheet: A clean navigation hub with six clickable buttons for instant access to dashboards and data sheets.
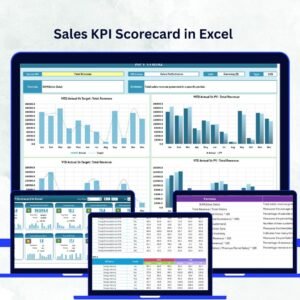
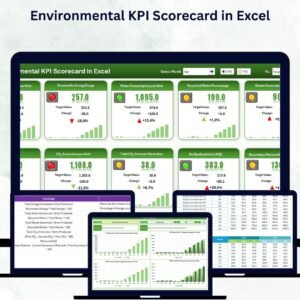
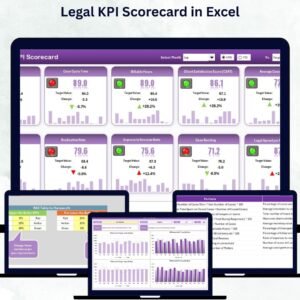
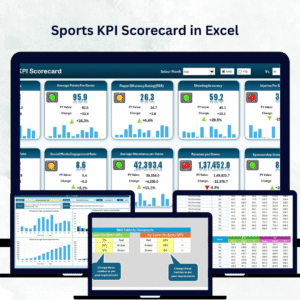
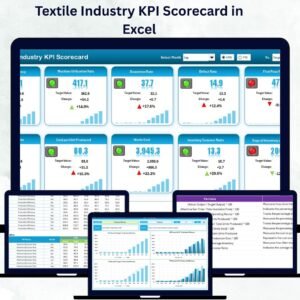
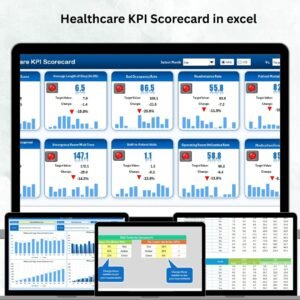
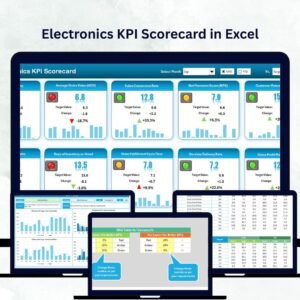
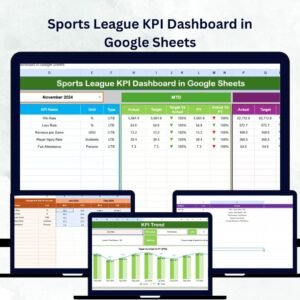
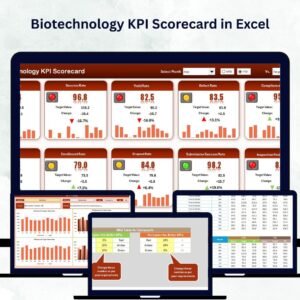
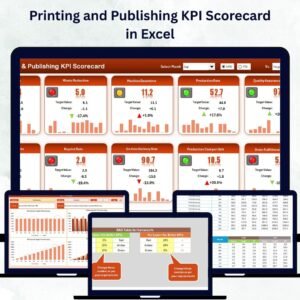
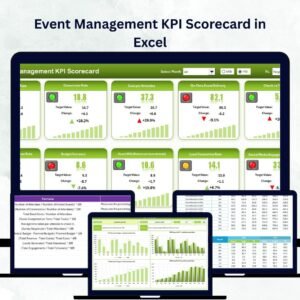
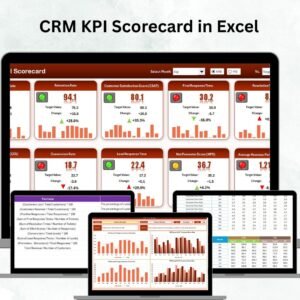
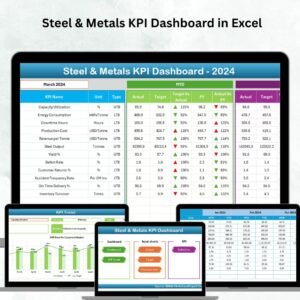
2️⃣ Dashboard Sheet: The main performance view showing MTD/YTD metrics, actual vs target comparisons, and conditional formatting indicators.
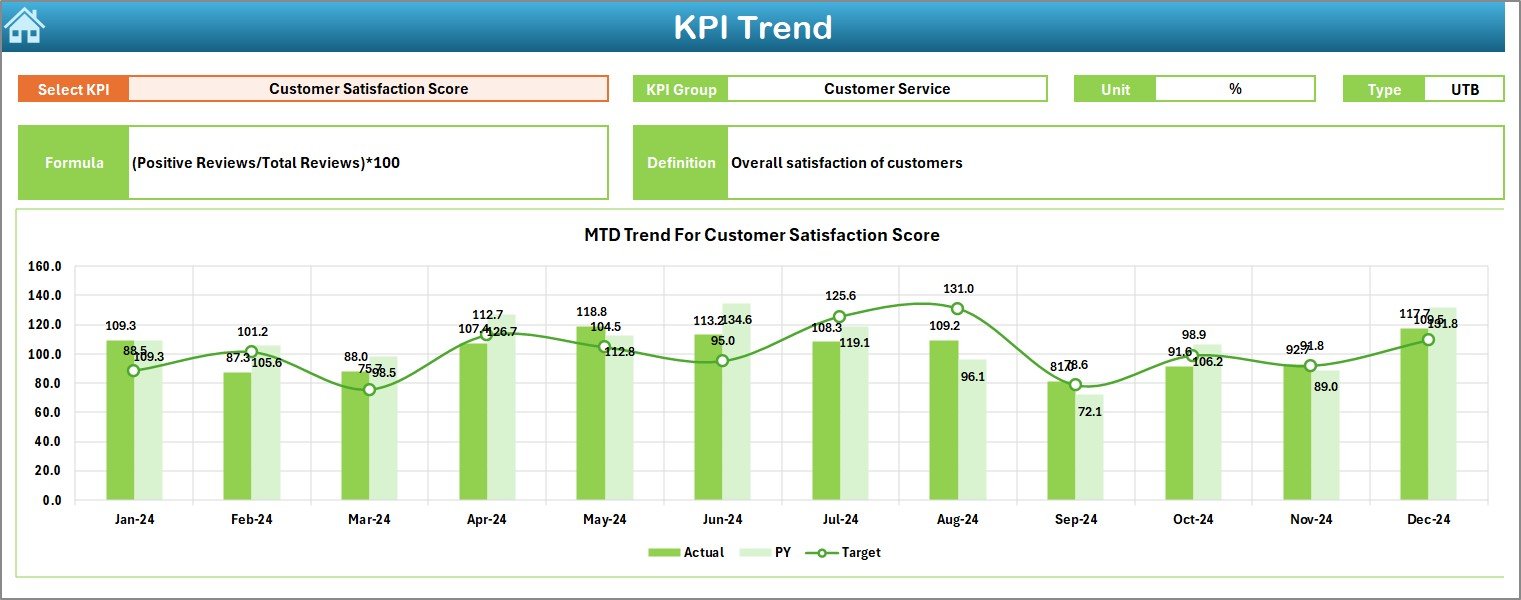
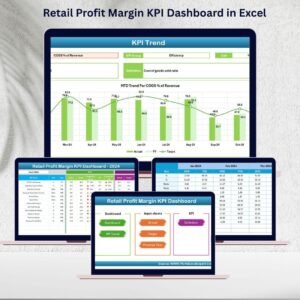
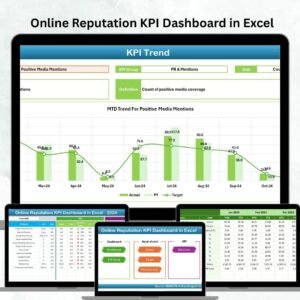
3️⃣ KPI Trend Sheet: Analyze performance trends over time — view KPI group, unit, type, and graphical trend lines for Actual, Target, and Previous Year (PY).
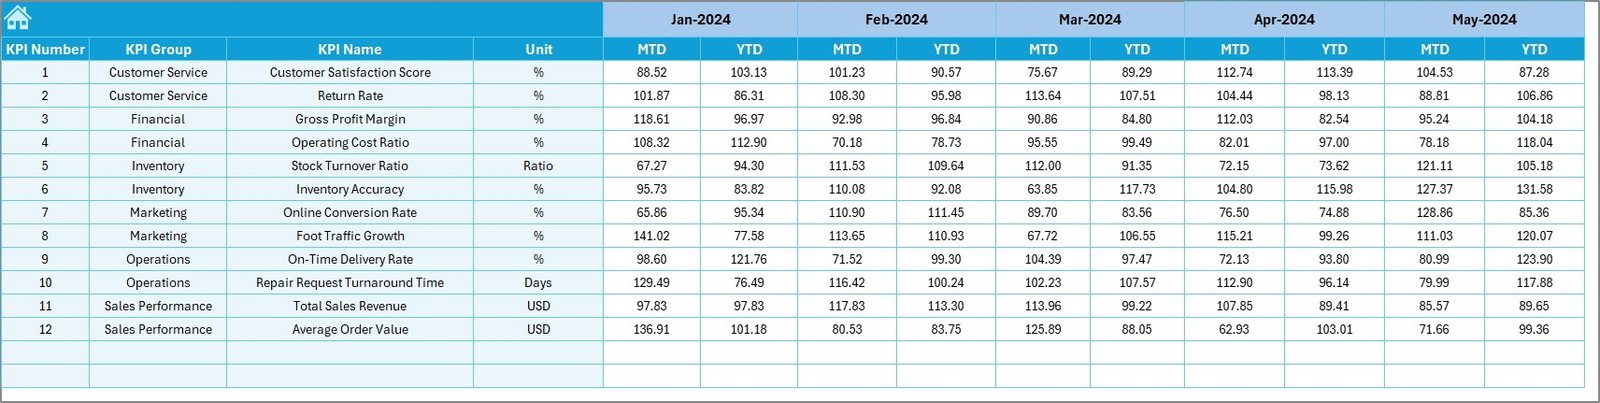
4️⃣ Actual Numbers Input Sheet: Enter MTD and YTD figures; data flows automatically into visuals.
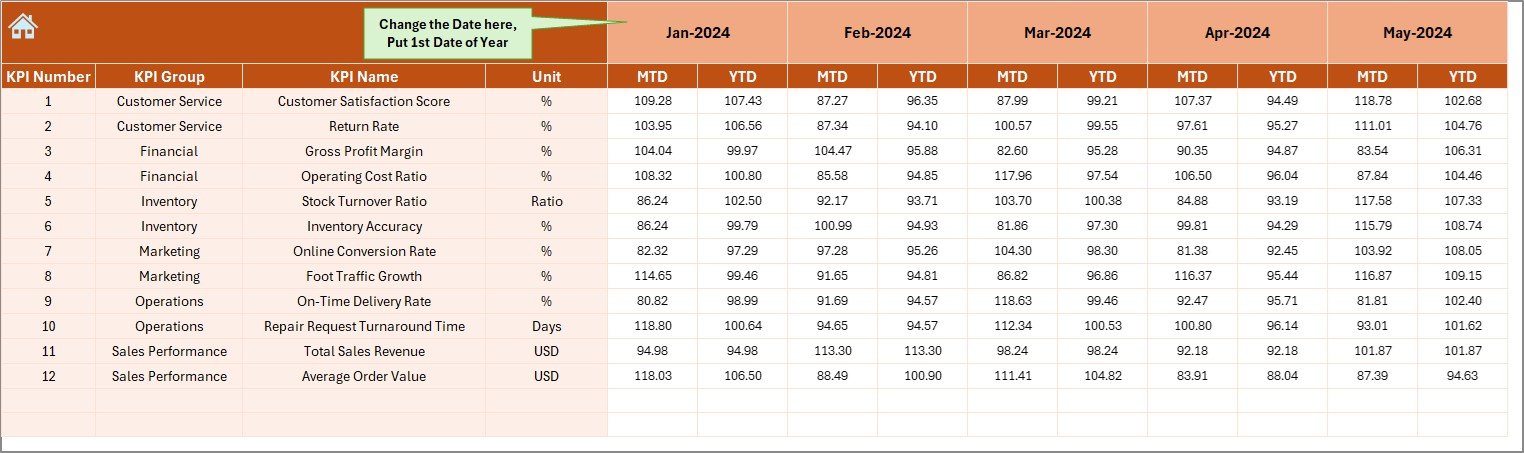
5️⃣ Target Sheet: Define monthly and yearly goals for every KPI to align your team’s performance expectations.
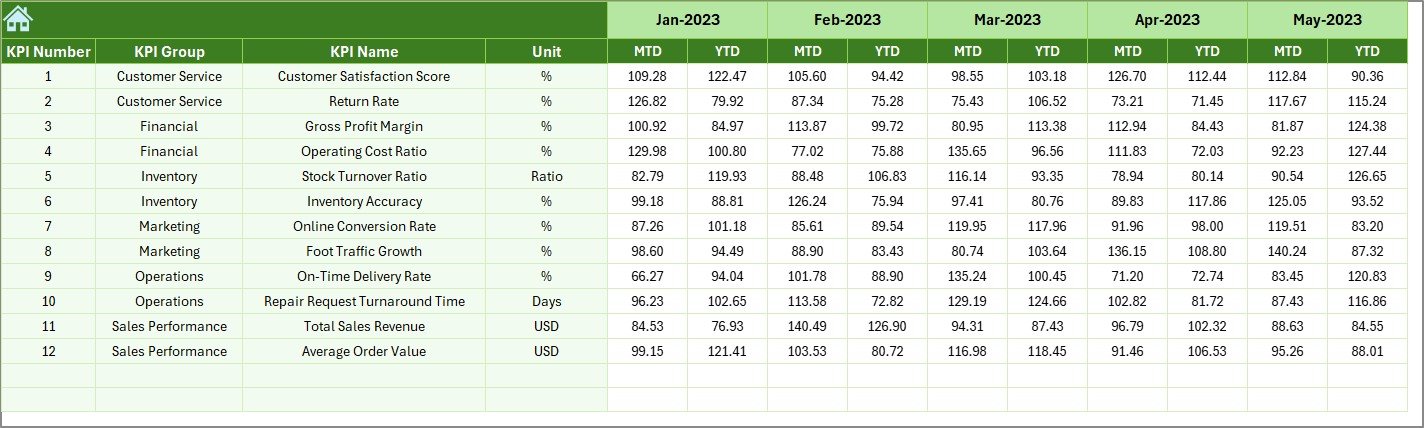
6️⃣ Previous Year Sheet: Record last year’s results to benchmark growth and identify trends.
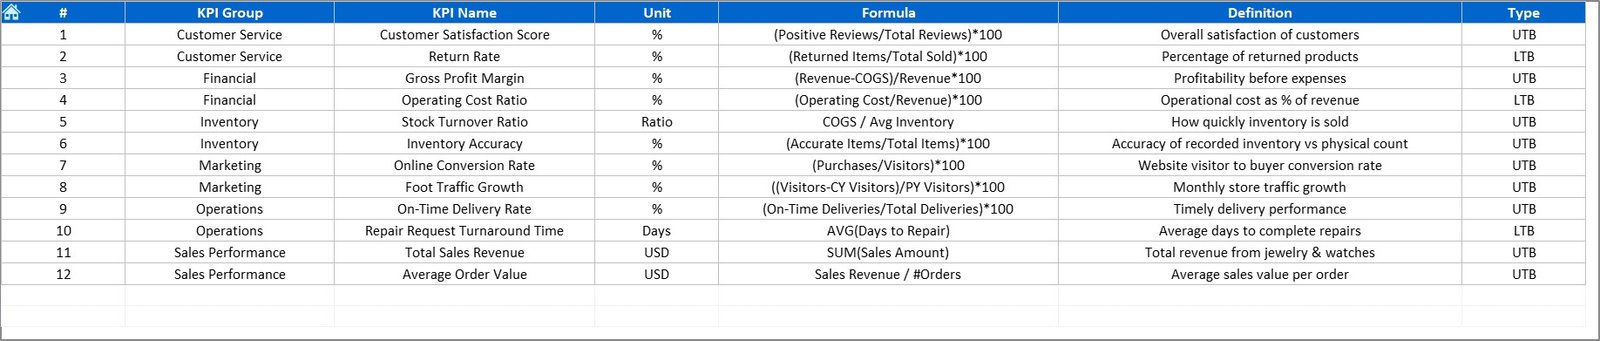
7️⃣ KPI Definition Sheet: Maintain consistency with KPI names, groups, units, formulas, and definitions — your in-house KPI dictionary!
Together, these sheets create a complete performance-tracking ecosystem for jewellery and watch retailers.
🧭 How to Use the Jewellery and Watches KPI Dashboard in Excel
🪄 Step 1: Open the Excel file and review the Home Sheet to explore navigation buttons.
📝 Step 2: Input actual performance data in the Actual Numbers Sheet.
🎯 Step 3: Set MTD and YTD goals in the Target Sheet.
📊 Step 4: Update previous-year data in the PY Sheet for comparison.
📈 Step 5: Go to the Dashboard Sheet to review live results, charts, and visual indicators.
📘 Step 6: Use the KPI Trend Sheet for detailed historical analysis.
In just minutes, you’ll have a fully automated dashboard showing your business performance — no coding or complex setup required!
👑 Who Can Benefit from This Jewellery and Watches KPI Dashboard
💼 Retail Owners: Track sales performance and profit margins in real time.
👩💻 Store Managers: Monitor daily sales, conversion rates, and team efficiency.
📦 Inventory Controllers: Manage high-value stock and avoid over- or under-stocking.
📊 Marketing Teams: Measure campaign ROI and customer-acquisition effectiveness.
📈 Finance Managers: Keep tabs on cost ratios, revenue growth, and margins.
🧠 Analysts: Generate quick, visual reports without complicated tools.
💎 Luxury Brand Executives: Get strategic insights for multi-store performance at a glance.
This Excel dashboard empowers every department to act decisively using accurate, up-to-date KPIs.
🔗 Click here to read the Detailed Blog Post
🎥 Visit our YouTube channel to learn step-by-step video tutorials
👉 YouTube.com/@PKAnExcelExpert


Reviews
There are no reviews yet.