
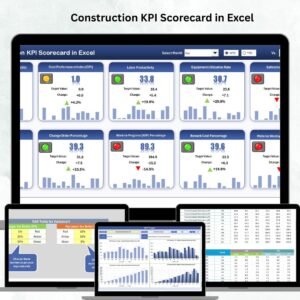
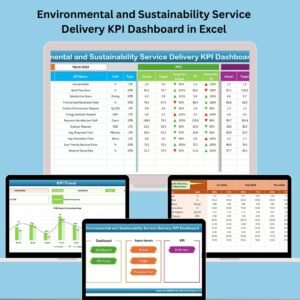
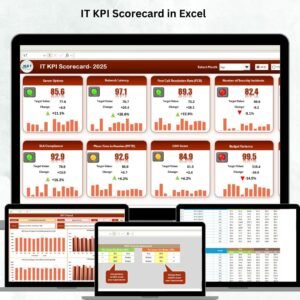
Measuring IT performance is critical for ensuring that technology consistently supports business goals. The IT KPI Scorecard in Excel is a ready-to-use template designed to track, analyze, and visualize the performance of key IT metrics. With this scorecard, IT managers and executives can monitor uptime, incident management, network performance, and service desk efficiency in one centralized system.
In this article, we’ll explore the features, advantages, and best practices of using this scorecard to strengthen IT operations.
What Is an IT KPI Scorecard?
An IT KPI Scorecard is a structured Excel-based performance monitoring tool that tracks IT operations through a set of well-defined key performance indicators (KPIs).
With this scorecard, IT managers can:
-
📊 Monitor monthly and yearly IT performance
-
🎯 Compare actual performance against targets
-
🔎 Identify underperforming areas quickly
-
✅ Make data-driven decisions to optimize IT operations
Key Features of the IT KPI Scorecard
The IT KPI Scorecard in Excel is designed for clarity, automation, and performance monitoring across multiple sheets.
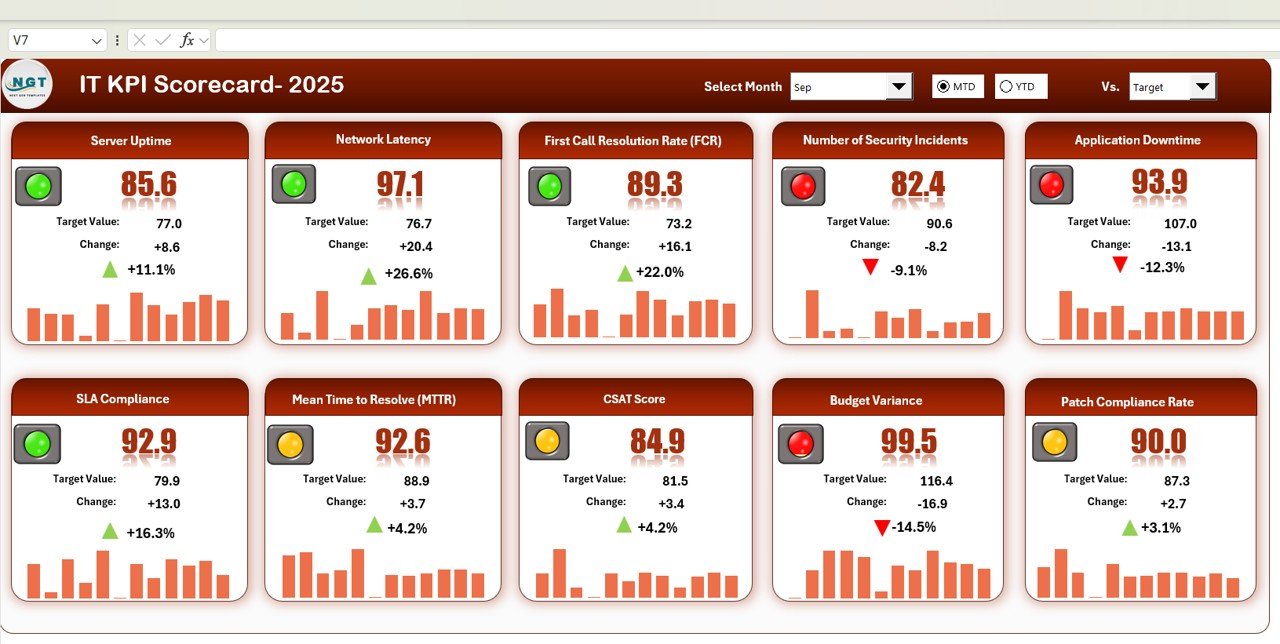
1. Scorecard Overview Sheet
-
Interactive Month Selection Dropdown – Select any month to display MTD (Month-to-Date) data.
-
MTD vs YTD Options – Switch between monthly and cumulative yearly performance.
-
Traffic Lights & Arrows – Conditional formatting instantly highlights performance:
-
✅ Green = On target
-
⚠️ Yellow = Needs attention
-
❌ Red = Below threshold
-
-
10 Pre-Built KPIs – Examples include:
-
System Uptime
-
Incident Response Time
-
Ticket Resolution Time
-
Server Availability
-
Network Performance
-
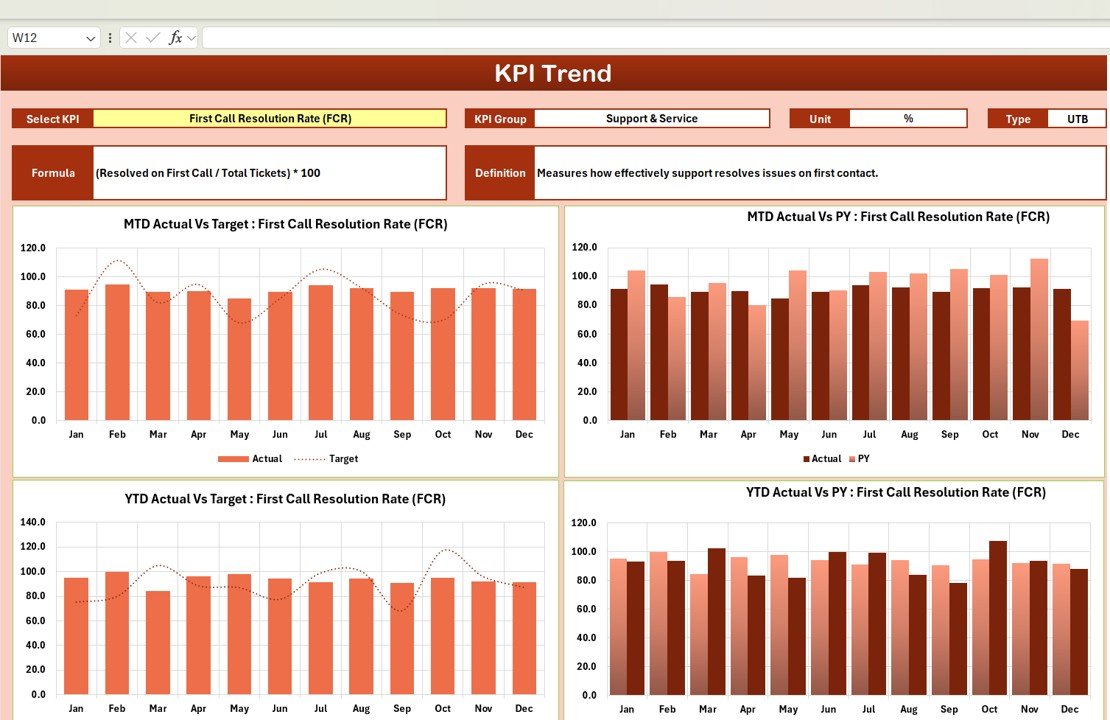
2. Trend Sheet Tab
-
Dropdown to select any KPI for historical trend analysis
-
Displays: KPI Group, Unit, Type (LTB or UTB)
-
Helps identify patterns and recurring performance issues
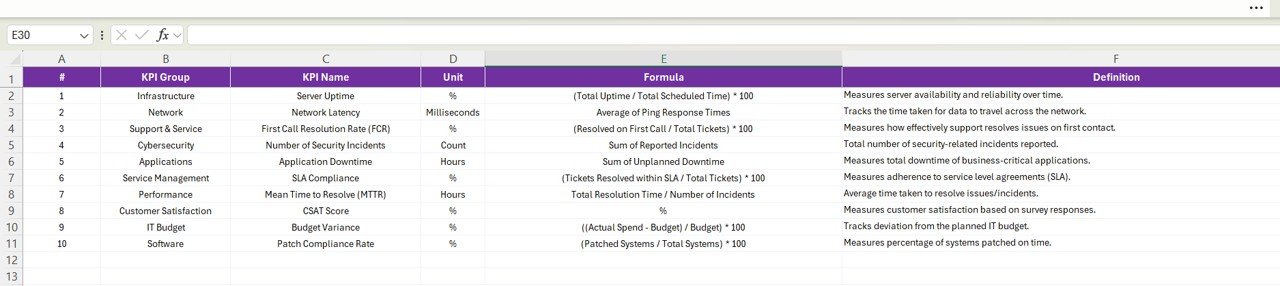
3. KPI Definition Sheet Tab
-
Stores reference details for every KPI, including:
-
KPI Name & Group
-
Unit of Measurement
-
Formula & Definition
-
KPI Type: Lower-the-Better (LTB) or Upper-the-Better (UTB)
-
-
Ensures clarity and consistency when interpreting results
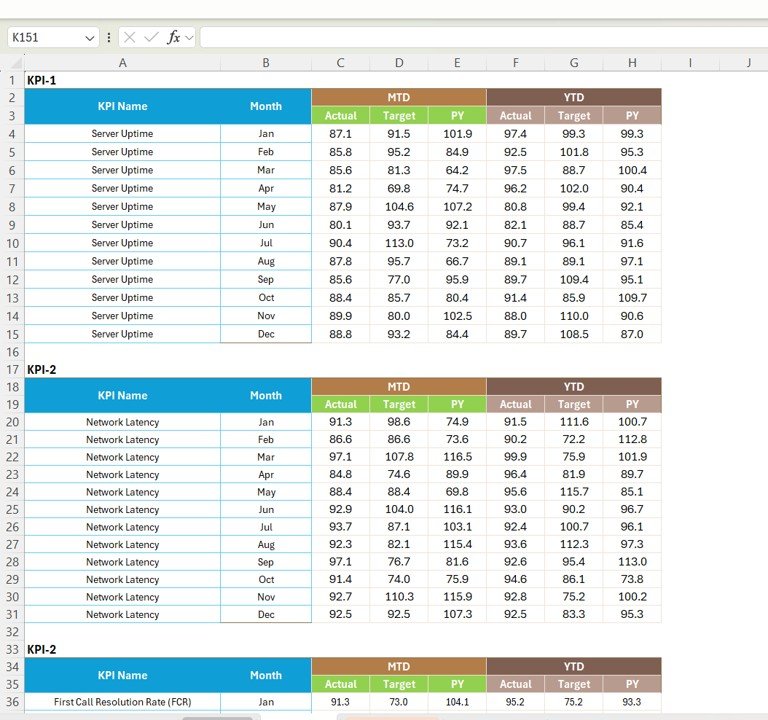
4. Data Input Sheet
-
Enter actual monthly or yearly performance values
-
Automatically updates the Overview and Trend sheets
-
Provides a structured and reliable data source
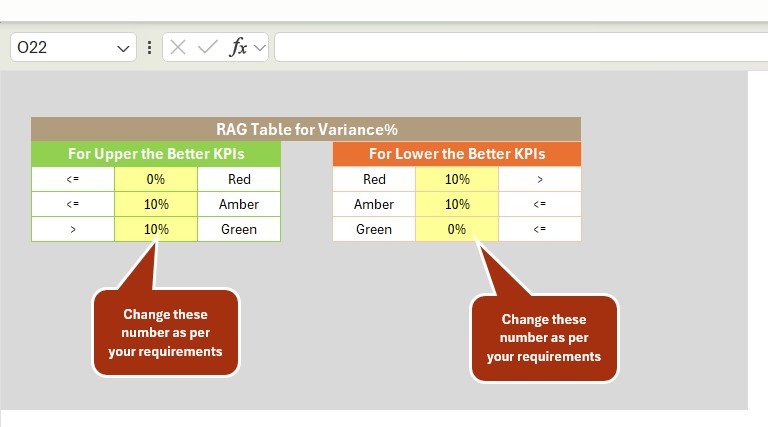
5. Color Settings Sheet
-
Fully customizable traffic light indicators
-
Adjust thresholds and color codes to match organizational standards
Advantages of Using the IT KPI Scorecard
✅ Centralized Monitoring – Track all IT KPIs in one place
✅ Visual Insights – Traffic lights and arrows make results easy to interpret
✅ Trend Analysis – Spot recurring issues with KPI historical trends
✅ Data-Driven Decisions – Use metrics to improve IT efficiency and planning
✅ Customizable Template – Add/edit KPIs, formulas, and colors as needed
✅ Time-Saving – Automates reporting and reduces manual effort
Best Practices for Using the Scorecard
-
🔄 Update Data Monthly – Ensure performance values are current
-
🎯 Focus on Critical KPIs – Prioritize metrics that directly impact operations
-
📈 Leverage Trend Analysis – Identify recurring issues or continuous improvements
-
🚦 Use Visual Indicators – Quickly spot red/yellow areas for proactive action
-
📑 Maintain KPI Definitions – Keep the KPI sheet updated to avoid confusion
-
🎨 Customize Colors & Thresholds – Match corporate reporting standards
How This Scorecard Helps IT Teams
-
Track System Uptime – Ensure mission-critical services remain operational
-
Monitor Incident Management – Measure response and resolution efficiency
-
Evaluate Network Health – Detect downtime and connectivity bottlenecks
-
Improve Service Desk Performance – Track tickets and client satisfaction
-
Support Strategic Planning – Align IT performance with business objectives
🔗 Click here to read the Detailed blog post
Watch the step-by-step video Demo:
🔗 Visit our YouTube channel for step-by-step video tutorials


Reviews
There are no reviews yet.