Managing IT assets doesn’t have to be a chaotic maze of spreadsheets and outdated trackers. The IT Asset Management Dashboard in Excel is a powerful, ready-to-use solution designed to bring clarity, structure, and control to your IT operations. ⚙️📊
Built with dynamic Excel dashboards and backed by organized data sheets, this tool helps IT managers, administrators, and business teams track hardware, software, licenses, warranties, depreciation, and more—all in one smart, visual interface.
Say goodbye to data silos and manual logs. With this dashboard, you get real-time insights, automated summaries, and intuitive visualizations that simplify your decision-making process.
🔑 Key Features of IT Asset Management Dashboard in Excel
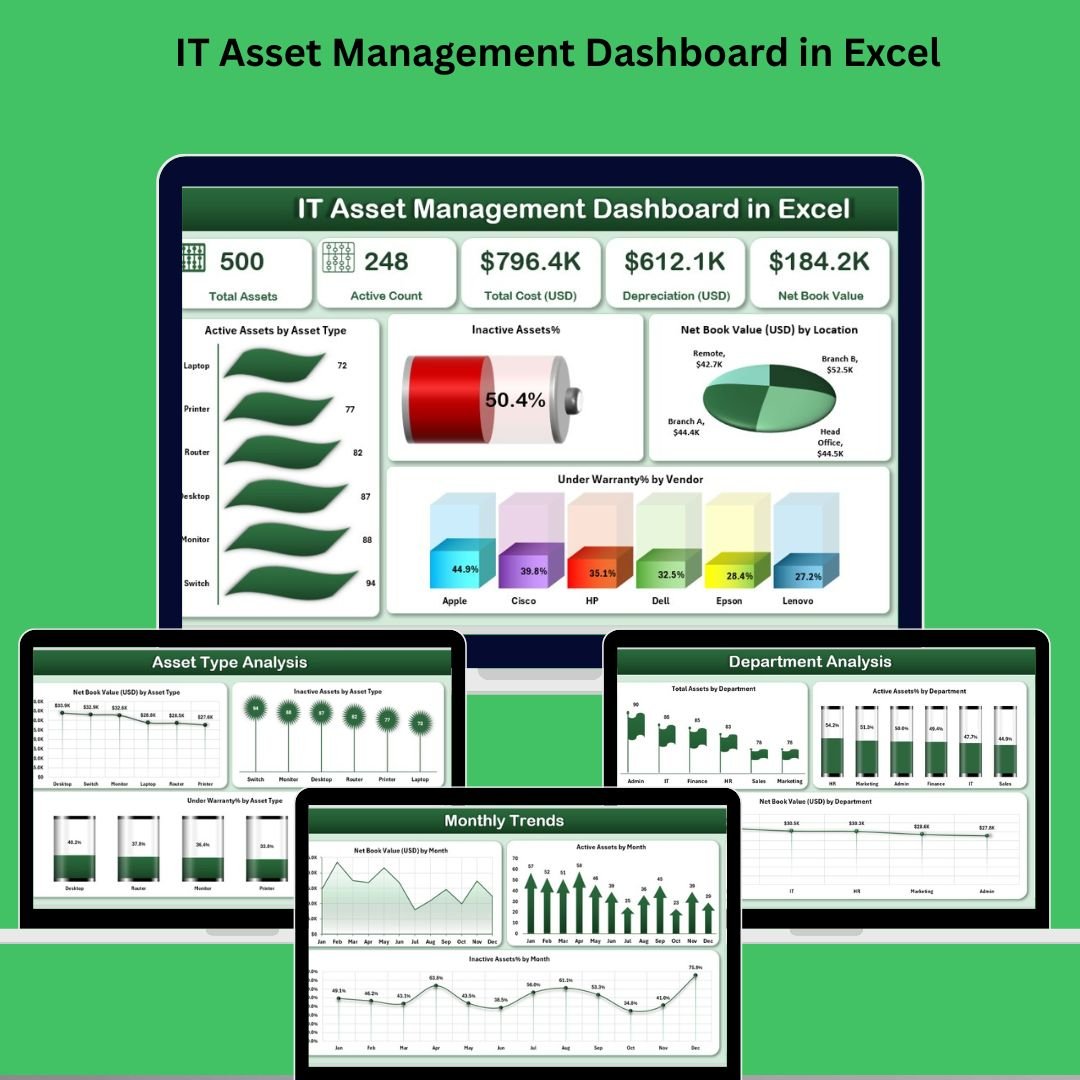
🧭 Overview Page – Your IT Command Center
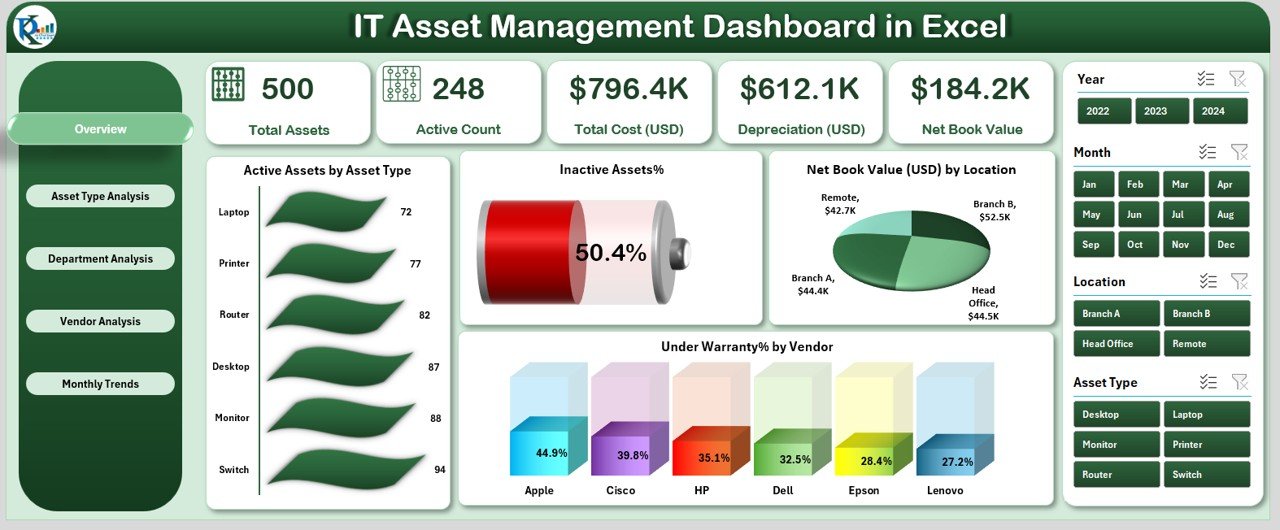
Gain a bird’s-eye view of your entire IT infrastructure with:
-
5 KPI Cards: Total Assets, Active Assets, Inactive Assets, Net Book Value, and Warranty Coverage
-
4 Charts: Active Assets by Type, Inactive Assets %, Net Book Value by Location, Under Warranty % by Vendor
Use slicers to filter by date, department, asset type, or vendor instantly.
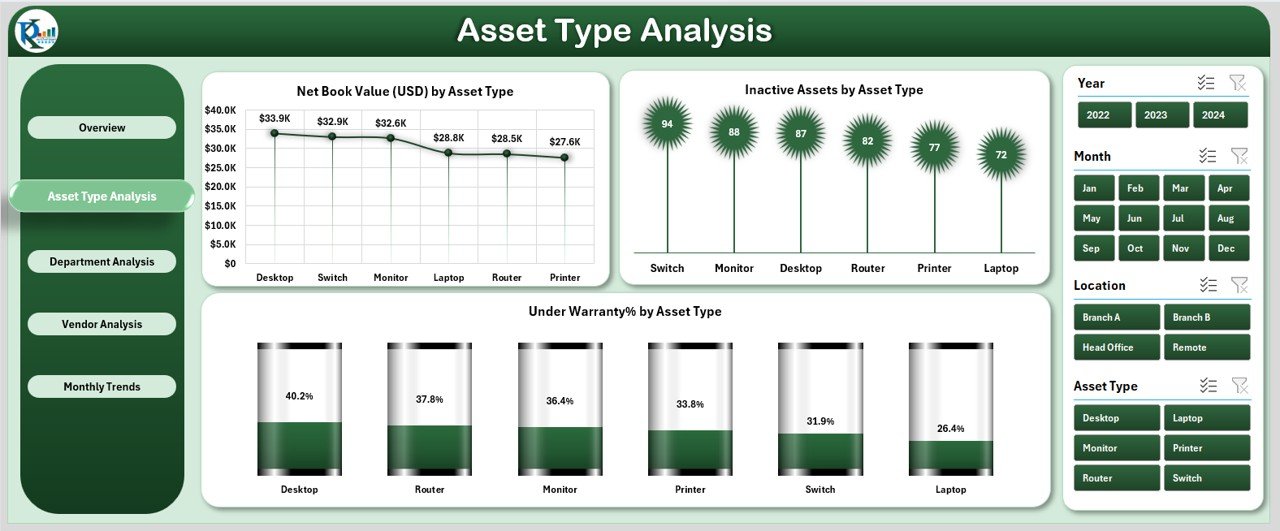
🖥️ Asset Type Analysis Page
See which asset categories are high-value or high-risk:
-
Net Book Value by Type
-
Inactive Assets by Type
-
Warranty Status by Asset Type
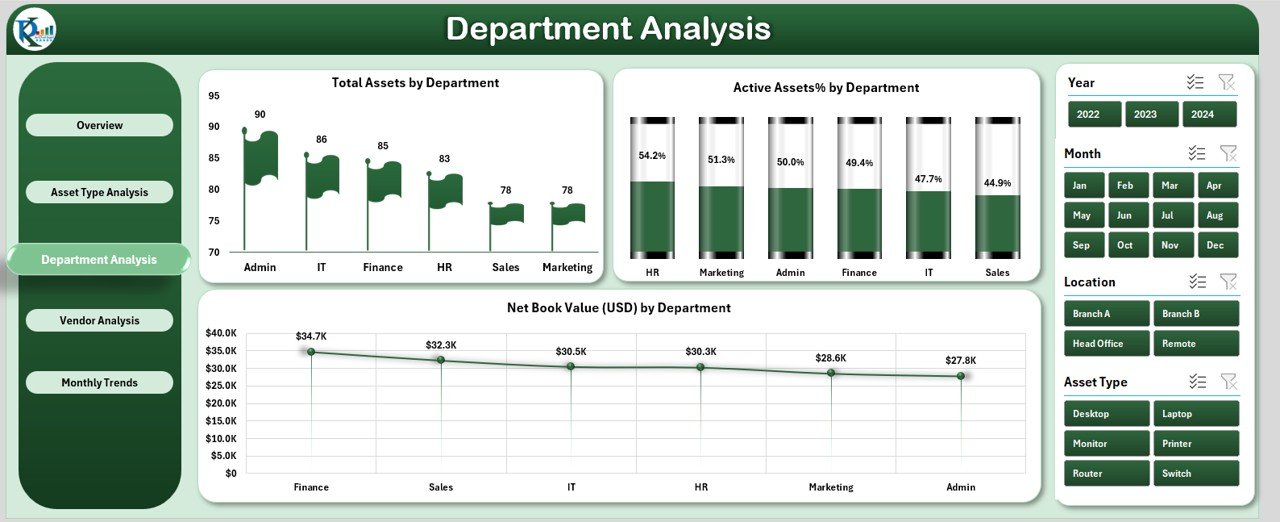
🏢 Department Analysis Page
Track how IT assets are allocated across departments:
-
Total Assets per Department
-
Active Asset % by Department
-
Net Book Value by Department
Perfect for budgeting and audits.
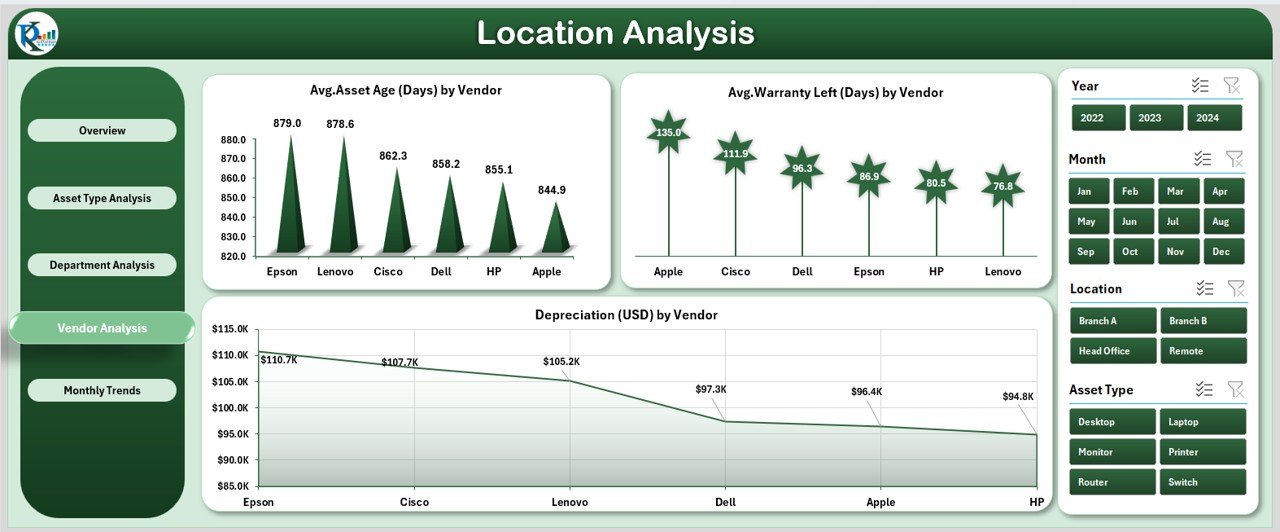
🌍 Location Analysis Page
Evaluate vendors and regional distributions:
-
Avg. Asset Age
-
Warranty Left (Days)
-
Depreciation by Vendor
-
Under Warranty % by Vendor
Helps you make better vendor and replacement decisions.
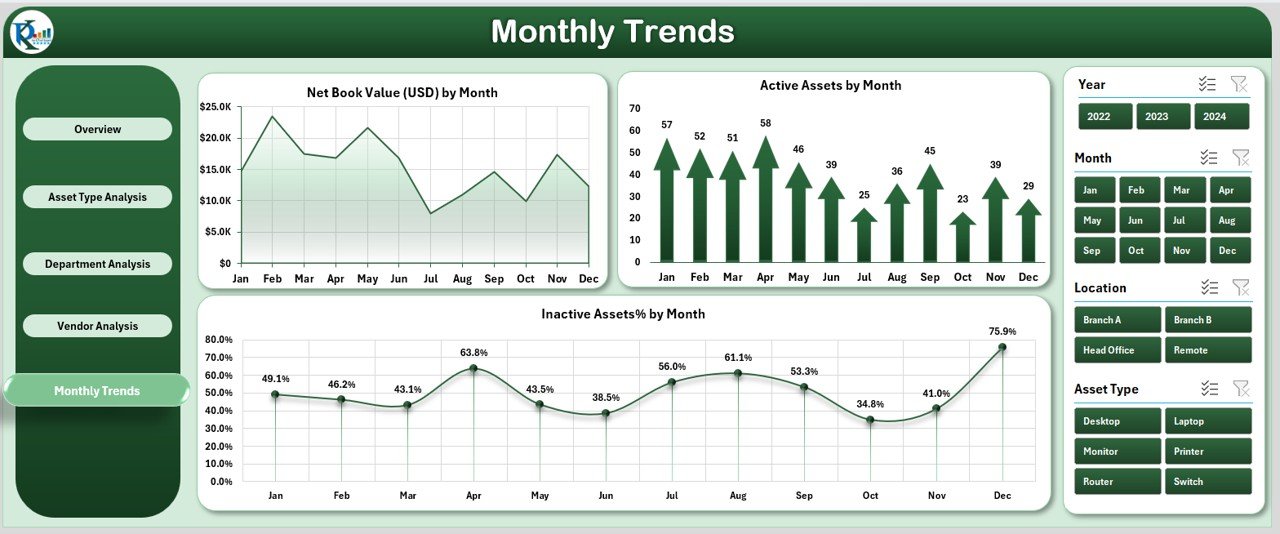
📆 Monthly Trends Page
Monitor how assets evolve over time:
-
Monthly Net Book Value
-
Active vs Inactive Assets
-
Inactive % by Month
Useful for planning and forecasting.
📦 What’s Inside the IT Asset Management Dashboard
📁 Excel File with PivotTables, slicers, and pre-built charts
📊 5 Dashboard Pages: Overview, Asset Type, Department, Location, Monthly Trends
📑 Data Sheet with fields like Asset ID, Purchase Date, Vendor, Warranty, Value, Depreciation
⚙️ Support Sheet for dropdown lists, formulas, and references
✅ Works with Excel 2016 or later—no add-ins or external tools required
🎯 Fully customizable to fit your organization’s structure and branding
🛠️ How to Use the IT Asset Dashboard
1️⃣ Open the Excel file and go to the Data Sheet
2️⃣ Enter your IT asset details (Asset ID, Type, Vendor, Value, Status, etc.)
3️⃣ Use predefined dropdowns for clean, consistent data
4️⃣ Navigate through dashboard pages using the Page Navigator
5️⃣ Use slicers to drill down by department, vendor, location, and more
6️⃣ Export or print pages for reports and presentations
💡 No advanced Excel skills needed. Just enter your data and the dashboard updates automatically!
🎯 Who Can Benefit from This Dashboard?
-
👨💼 IT Managers – Stay on top of all IT infrastructure
-
🧾 Inventory & Asset Officers – Maintain accurate records
-
🏢 Corporate Procurement Teams – Monitor spend and vendor performance
-
🧑💻 Facility Managers – Track asset deployment by location
-
📋 Internal Auditors – Ensure compliance and depreciation records
-
💼 Small Business Owners – Manage IT efficiently without ERP software
🔗 Click here to read the Detailed blog post
🎥 Visit our YouTube channel to learn step-by-step video tutorials
(YouTube.com/@PKAnExcelExpert)


Reviews
There are no reviews yet.