International development projects impact millions of lives—whether through healthcare, education, or community programs. But with multiple projects spread across regions, managers, and funding sources, tracking progress and ensuring accountability can feel overwhelming.
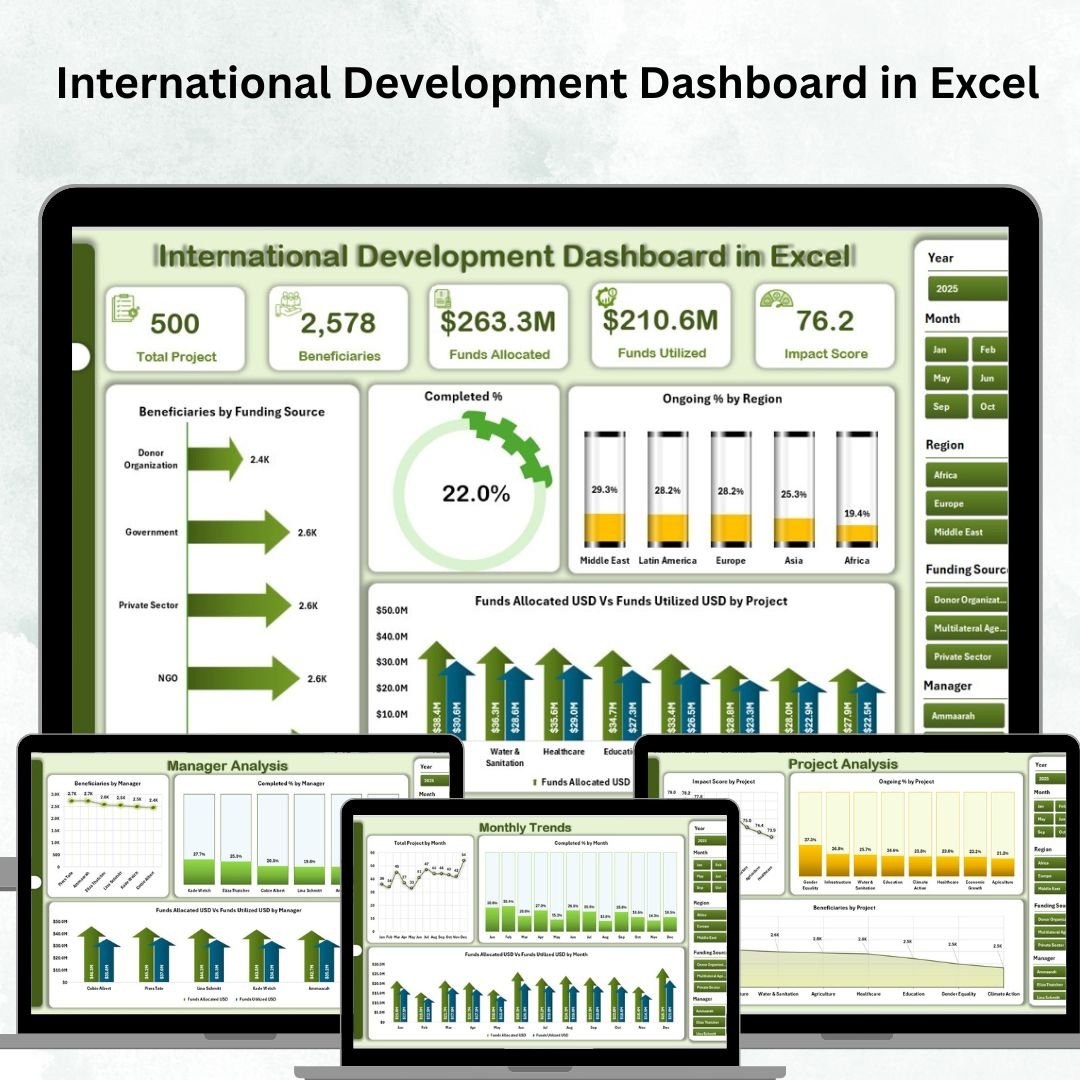
That’s why we built the International Development Dashboard in Excel — a ready-to-use, interactive, and customizable tool that helps NGOs, donor agencies, and government bodies streamline reporting, monitor funds, and measure project impact all in one place.
Instead of scattered spreadsheets and manual reports, this dashboard centralizes your data into clean, visual, and actionable insights, giving you the clarity you need to make better decisions.
✨ Key Features of the International Development Dashboard in Excel
✅ Page Navigator – Located on the left for quick access to each section.
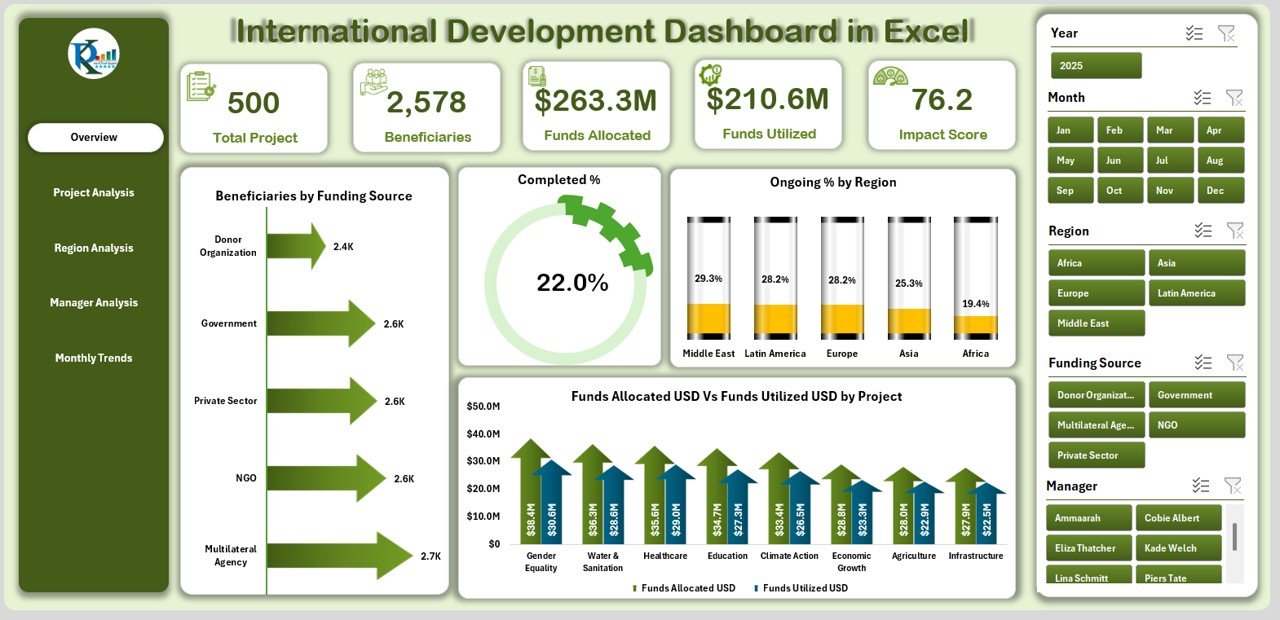
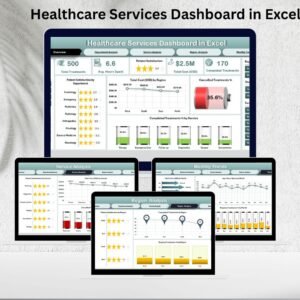
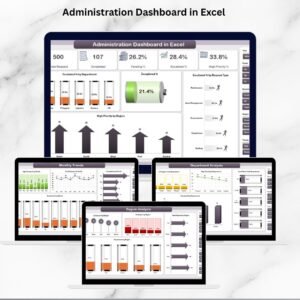
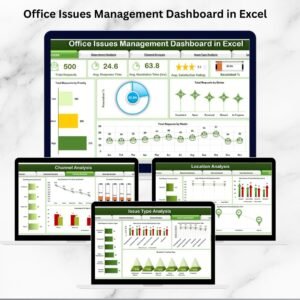
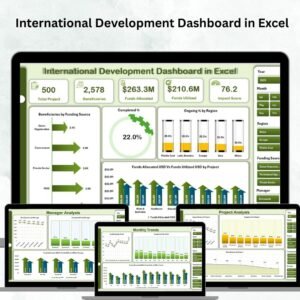
✅ Overview Page – A high-level snapshot with:
-
5 KPI Cards (beneficiaries, funds, completion %, ongoing %, etc.)
-
Charts for Beneficiaries by Funding Source, Completed %, Ongoing % by Region, Funds Allocation vs. Utilized 💰
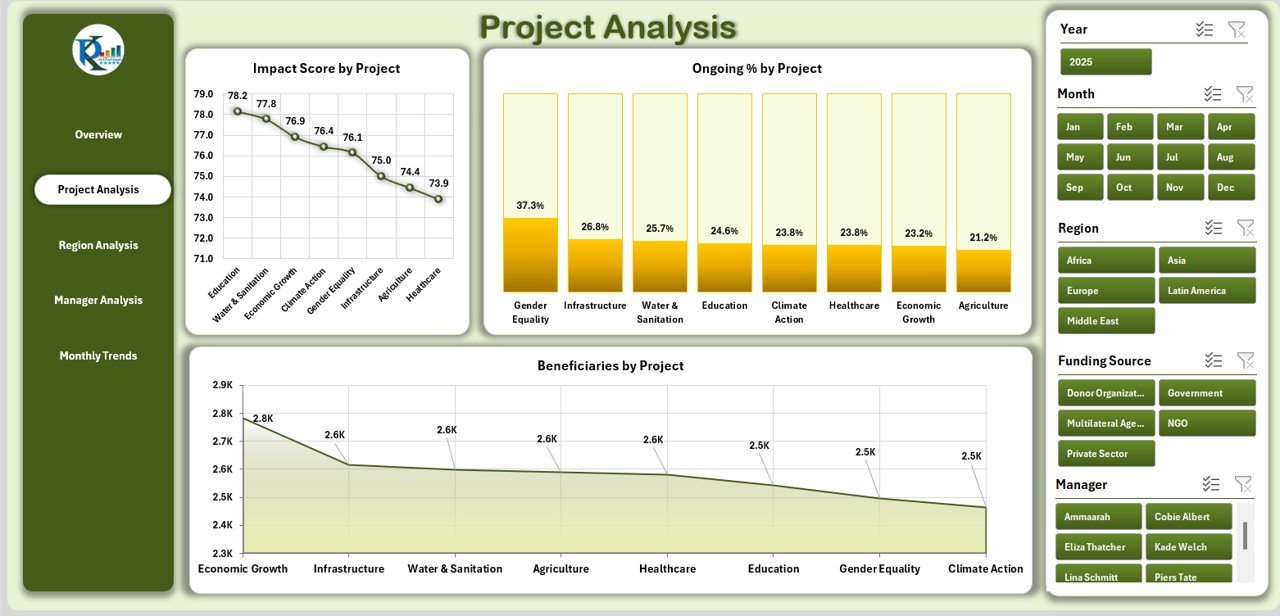
✅ Project Analysis Page – Drill into individual projects:
-
Charts for Impact Score, Ongoing %, and Beneficiaries by Project.
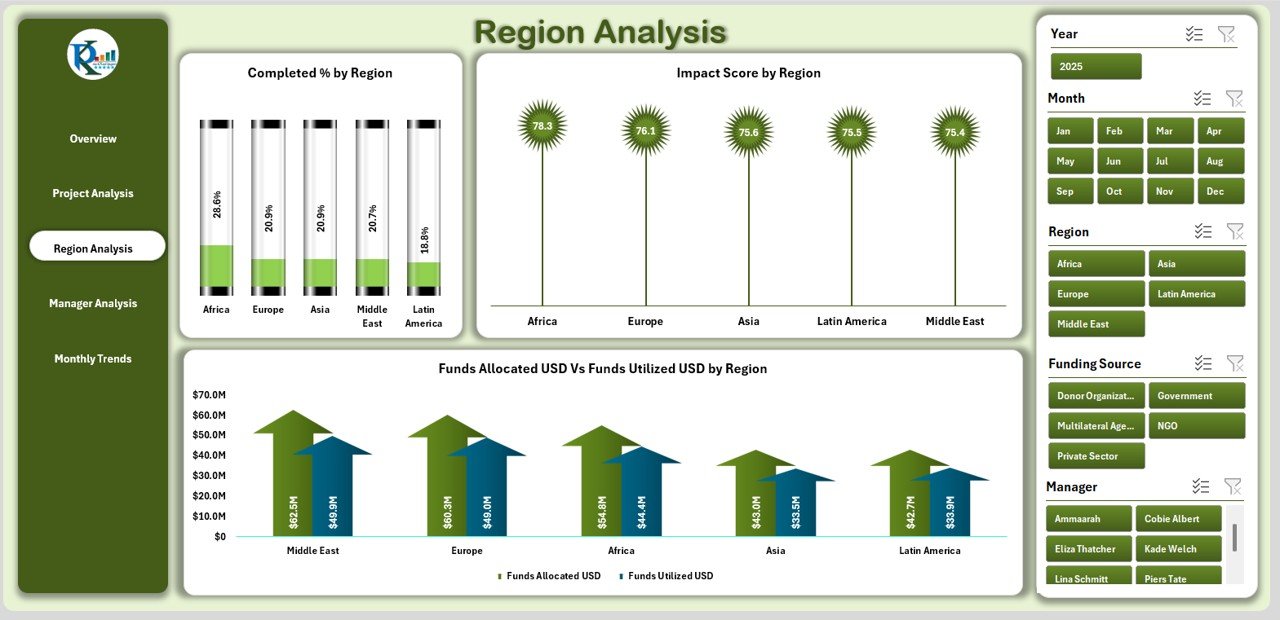
✅ Region Analysis Page – Compare regional outcomes:
-
Completed %, Impact Score, and Funds Allocation vs. Utilization 🌍
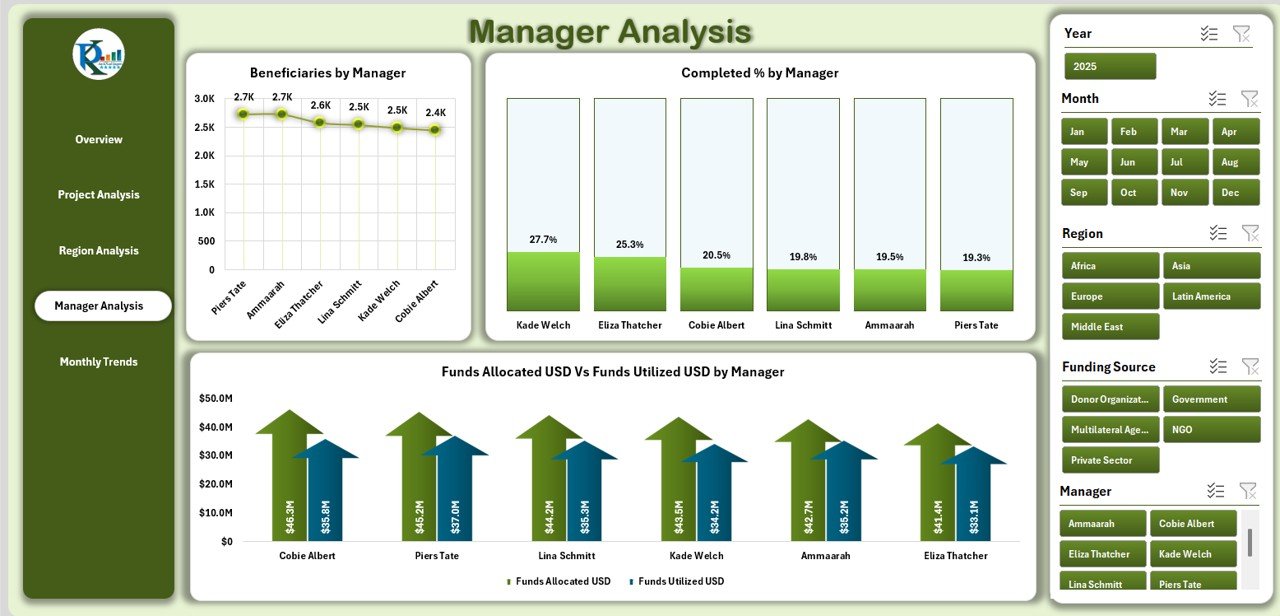
✅ Manager Analysis Page – Ensure accountability at the manager level:
-
Beneficiaries by Manager, Completed %, and Funds Allocation vs. Utilization 👩💼
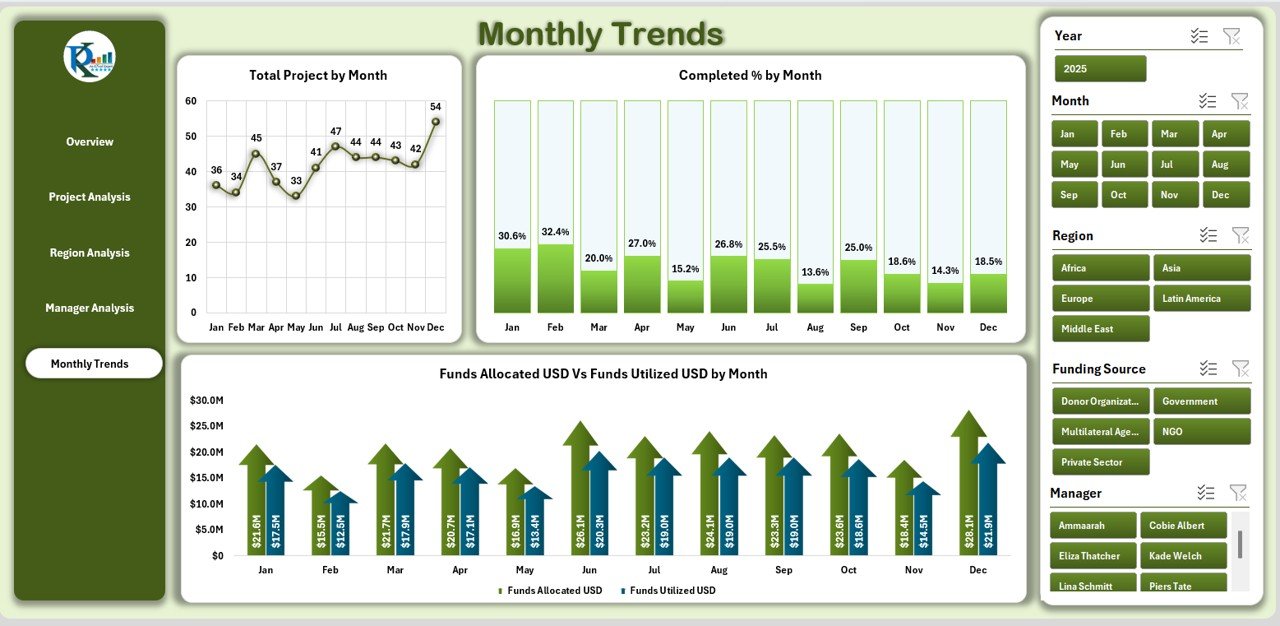
✅ Monthly Trends Page – Track progress over time with:
-
Charts for Projects by Month, Completion %, and Funds Allocation vs. Utilized 📆
✅ Support Sheet – Raw data, lookup lists, and reference values for automation.
📂 What’s Inside the International Development Dashboard in Excel
When you download this dashboard, you get:
-
5 Interactive Pages (Overview, Project, Region, Manager, Monthly Trends).
-
Support Sheet for data entry and automation.
-
Dynamic Slicers for easy filtering by region, project, or manager.
-
KPI Cards & Charts for performance tracking at a glance.
-
Customizable fields for adapting to your organization’s unique reporting needs.
⚡ How to Use the Dashboard
1️⃣ Enter Project Data – Add funding, beneficiaries, completion %, and regional details in the Support Sheet.
2️⃣ Navigate Pages – Use the Page Navigator to switch between analysis views.
3️⃣ Filter with Slicers – Drill into projects, regions, or managers easily.
4️⃣ Interpret Visuals – Analyze performance, utilization, and impact through interactive charts.
5️⃣ Generate Reports – Export visuals to PDF or presentations for stakeholders and donors.
🎯 Who Can Benefit from This Dashboard?
-
🌍 NGOs & Non-Profits – Track multiple aid projects efficiently.
-
🏛 Government Departments – Manage regional and national programs.
-
💰 Donor Agencies – Ensure transparency and accountability in fund allocation.
-
👨💼 Project Managers – Monitor completion rates and team performance.
-
📊 Consultants – Build M&E (Monitoring & Evaluation) frameworks for clients.
✅ Why Choose This Dashboard?
-
📊 Centralized Data – All projects, funds, and beneficiaries in one file.
-
⚡ Real-Time Decisions – Up-to-date data enables quicker action.
-
✔ Improved Accountability – Track manager and region-level performance.
-
💰 Donor Confidence – Transparent reporting builds trust.
-
🛠 Flexible & Customizable – Modify KPIs, charts, and filters as needed.
-
🌐 Offline Access – Works even in regions with poor internet.
-
💡 Cost-Effective – No extra software—just Excel.
📖 Click here to read the Detailed blog post
📺 Visit our YouTube channel to learn step-by-step video tutorials


Reviews
There are no reviews yet.