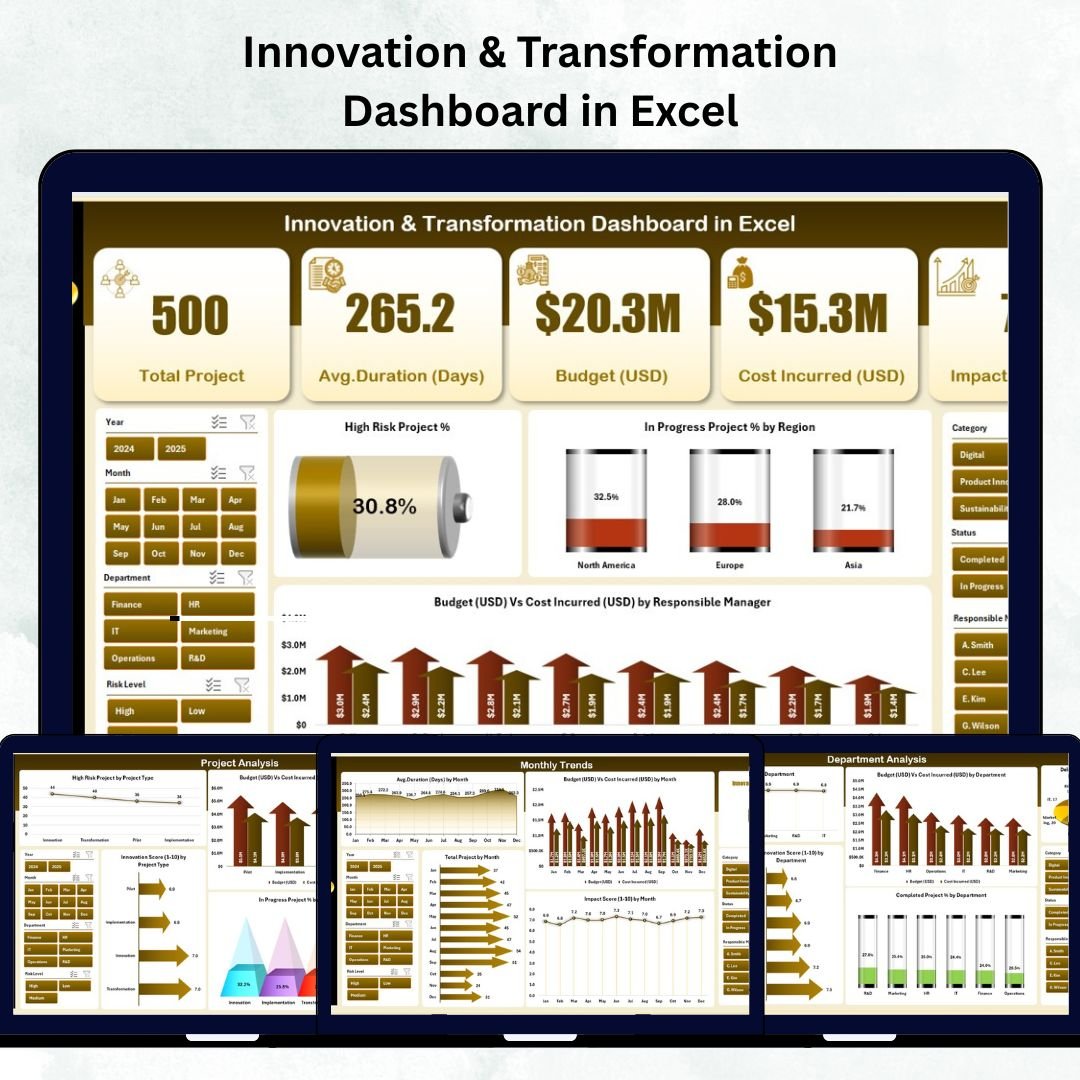
In today’s competitive world, innovation isn’t optional — it’s essential. But without structured tracking, even the best transformation ideas can lose focus or exceed budgets. The Innovation & Transformation Dashboard in Excel provides the ultimate solution — a ready-to-use, interactive analytics tool that helps you measure innovation success, control budgets, and monitor progress in real time.
Built entirely in Microsoft Excel, this dashboard transforms complex project data into easy-to-understand visuals. It’s perfect for managers, executives, and transformation leaders who need instant clarity on where projects stand, what’s working, and what needs attention — all without any coding or Power BI experience.
⚙️ Key Features of the Innovation & Transformation Dashboard in Excel
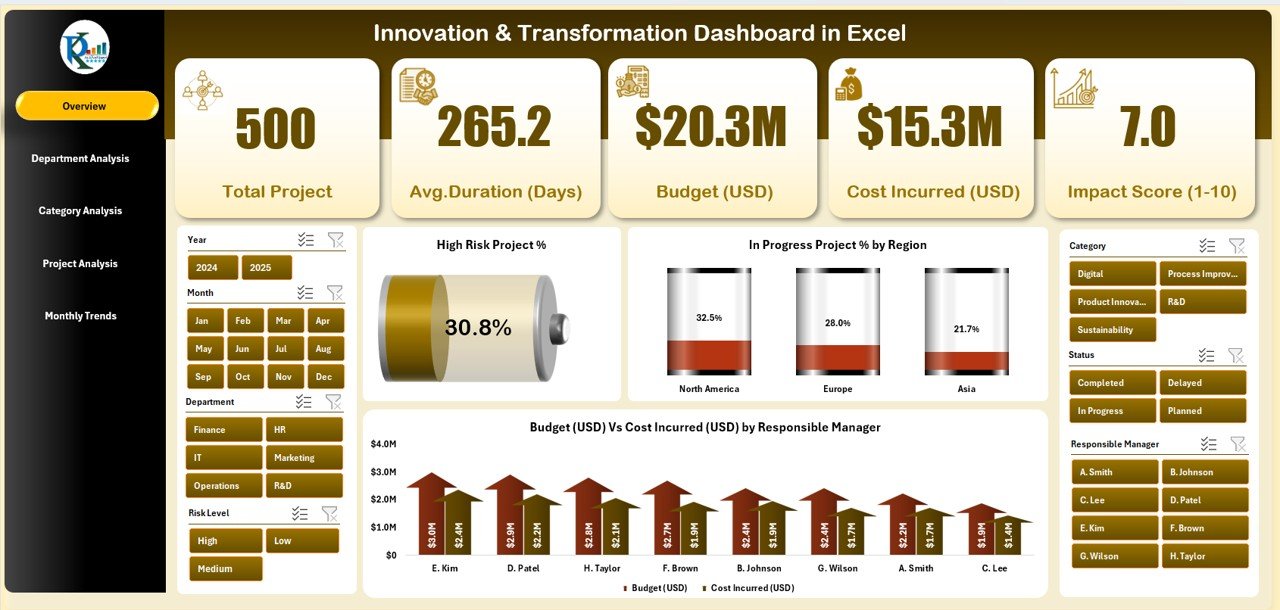
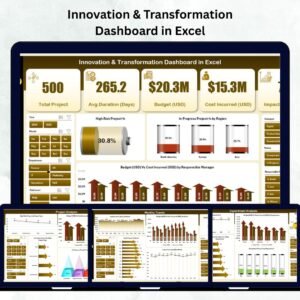
🏠 1️⃣ Overview Page – Your Command Center
-
🎯 Five Summary Cards: Total Projects, Completed Projects, High-Risk %, Innovation Score, Budget Utilization.
-
🧭 Right-Side Slicers: Instantly filter by Month, Manager, or Region.
-
📊 Key Charts:
-
High-Risk Project %
-
In-Progress Project % by Region
-
Budget vs Cost by Manager
-
💡 Quickly identify over-budget projects, delayed initiatives, and regional performance gaps.
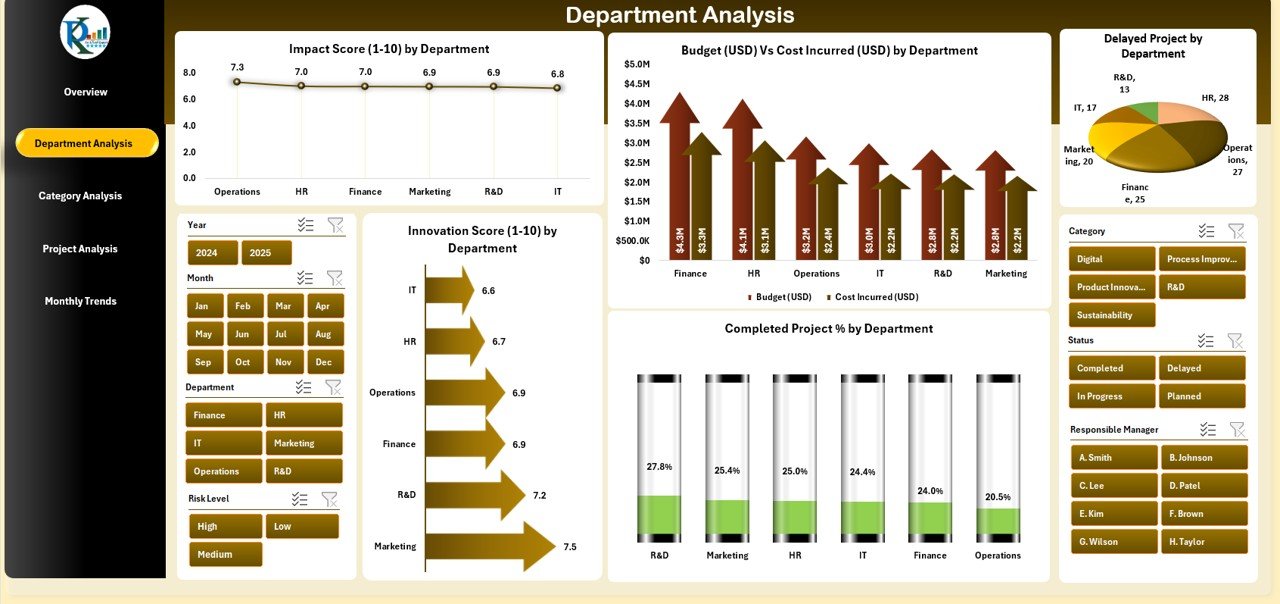
🧩 2️⃣ Department Analysis Page – Evaluate Performance Across Teams
Analyze innovation effectiveness department-wise.
Includes:
-
Impact Score (1-10) by Department
-
Innovation Score by Department
-
Budget vs Cost Incurred by Department
-
Completed Project % by Department
-
Delayed Projects by Department
📈 Reveal which departments are driving change and which need process support.
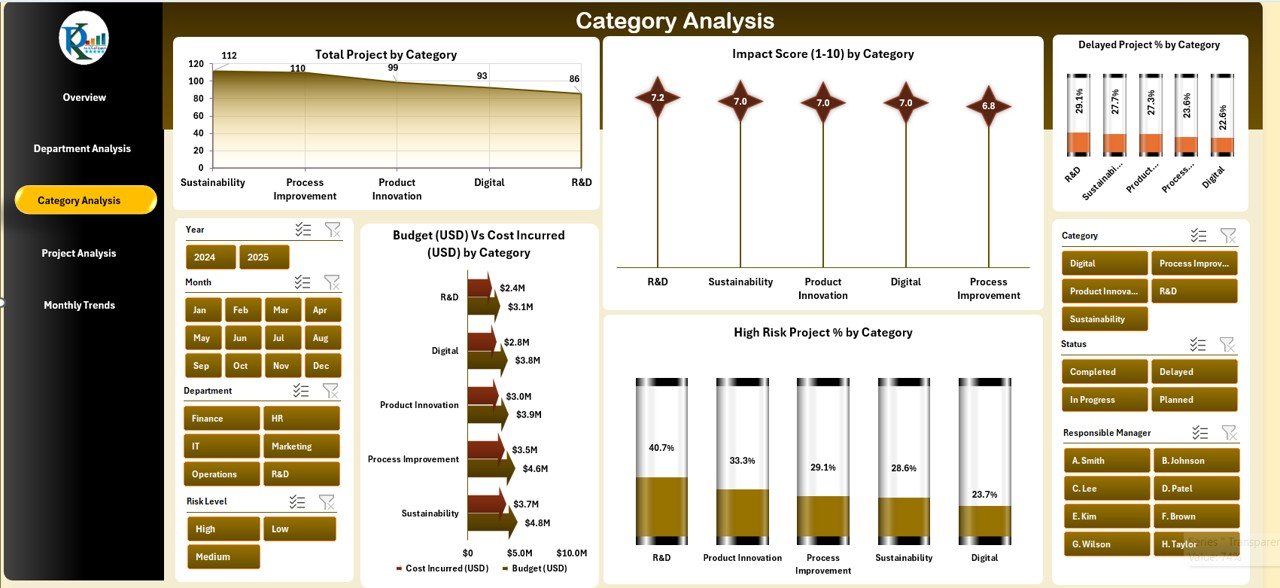
🧠 3️⃣ Category Analysis Page – Understand Innovation Focus
Compare how different project categories perform — product development, digital transformation, process improvement, and more.
Visuals include:
-
Total Projects by Category
-
Impact Score (1-10) by Category
-
Budget vs Cost (USD) by Category
-
High-Risk % & Delayed % by Category
🎯 Pinpoint high-impact categories and allocate resources more effectively.
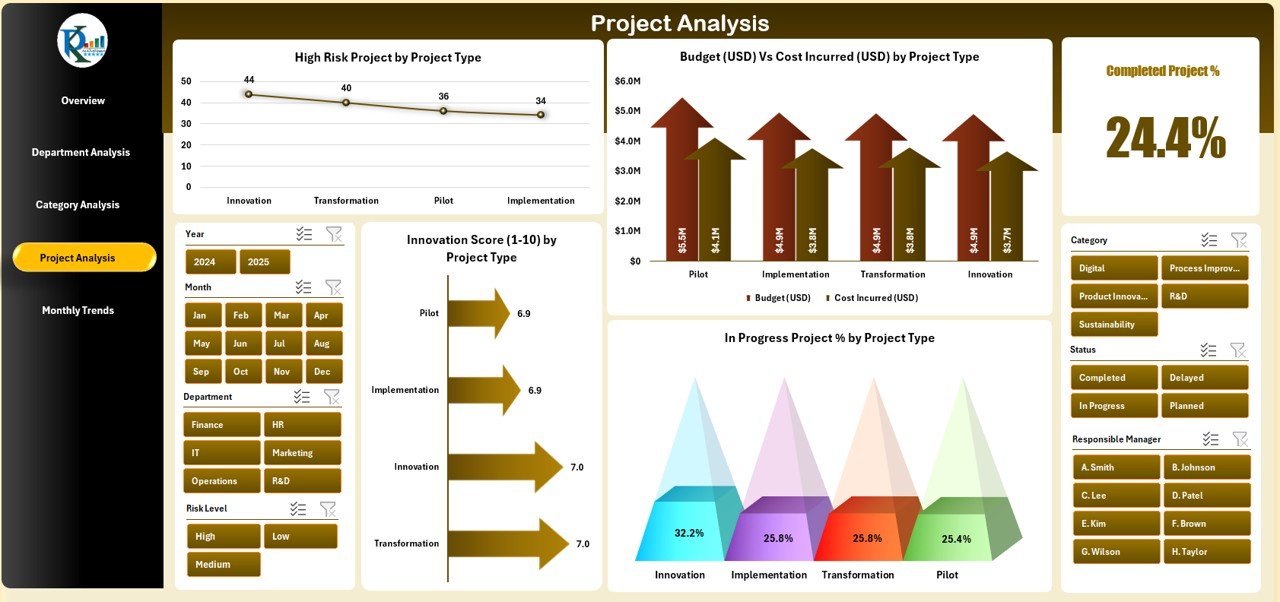
🧾 4️⃣ Project Analysis Page – Drill Down to the Details
Track every innovation initiative in detail.
Charts:
-
High-Risk Project % by Project Type
-
Budget vs Cost Incurred by Project Type
-
Innovation Score (1-10) by Project Type
-
In-Progress Project % by Project Type
🧭 Perfect for project managers seeking a clear view of performance and financial alignment.
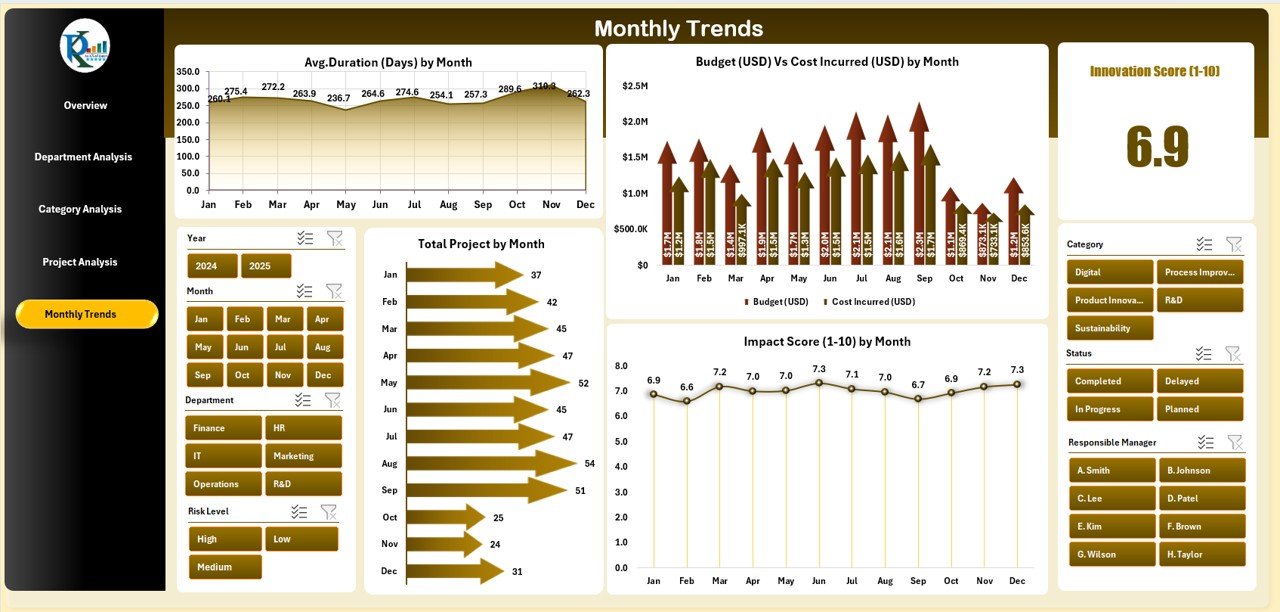
📅 5️⃣ Monthly Trends Page – Track Progress Over Time
Visualize month-to-month trends for smarter planning.
Charts:
-
Average Duration (Days) by Month
-
Budget vs Cost Incurred by Month
-
Total Projects by Month
-
Impact Score (1-10) by Month
📆 Detect seasonal patterns, forecast budgets, and evaluate project velocity.
🧮 What’s Inside the Dashboard
✅ 5 Interactive Pages + Support Sheets
✅ Data Sheet with Project Details (Project Name, Dept, Region, Cost, Budget, Innovation Score etc.)
✅ Support Sheet for Formulas & Dropdowns
✅ Auto-Refreshing Pivot Tables & Charts
✅ Dynamic Filters for Month, Manager, Region
Everything is fully automated — just update the data and Excel does the rest.
🌟 Advantages of Using the Innovation & Transformation Dashboard in Excel
✅ Centralized Performance Tracking – All projects in one file.
✅ Real-Time Insights – Automatic formulas update instantly.
✅ Better Resource Allocation – Identify where to invest time and budget.
✅ Enhanced Decision-Making – Data-driven reports replace guesswork.
✅ Customizable & Flexible – Add new KPIs or visuals any time.
✅ No Coding Required – Runs entirely on Excel functions & pivots.
🧭 How to Use the Dashboard Effectively
1️⃣ Input your project data into the Data Sheet.
2️⃣ Click “Refresh All” to update KPIs and charts.
3️⃣ Navigate between pages using the left-side menu.
4️⃣ Filter by month, manager, or department for targeted insights.
5️⃣ Use findings to adjust budgets, timelines, and strategies.
🧩 No technical setup needed — you’ll start seeing results within minutes.
👨💼 Who Can Benefit from This Dashboard
-
Project Managers – Monitor timelines and budgets.
-
Department Heads – Compare innovation output.
-
Executives – Assess strategic impact and ROI.
-
Finance Teams – Track budget utilization.
-
R&D Leaders – Measure innovation scores and project success.
Whether you’re driving digital transformation or continuous improvement, this tool keeps you in control of your innovation journey.
🔗 Click here to read the Detailed blog post
📺 Visit our YouTube channel for step-by-step tutorials
👉 YouTube.com/@PKAnExcelExpert


Reviews
There are no reviews yet.