


Influencer marketing is one of the most powerful digital growth strategies today—but only when you track the right numbers. Brands work with creators, micro-influencers, macro-influencers, and brand ambassadors, yet most struggle with scattered screenshots, inconsistent reporting, and manual calculations. The Influencer Engagement KPI Dashboard in Google Sheets solves all these problems with one clean, automated, cloud-based analytics system.
This dashboard gives you a complete performance picture of your influencer campaigns. Whether you want to track engagement rate, clicks, conversions, cost per content piece, ROI, impressions, or audience quality—this tool presents everything in a clear, visual, and easy-to-understand format. Built entirely in Google Sheets, it requires no software installation, works anywhere, and updates automatically based on your selected month.Influencer Engagement KPI Dashboard in Google Sheets
If you manage influencer programs for a brand, agency, or e-commerce business, this dashboard gives you the clarity, accuracy, and confidence you need to make smarter decisions.Influencer Engagement KPI Dashboard in Google Sheets

✨ Key Features of the Influencer Engagement KPI Dashboard in Google Sheets
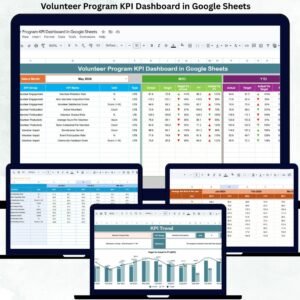
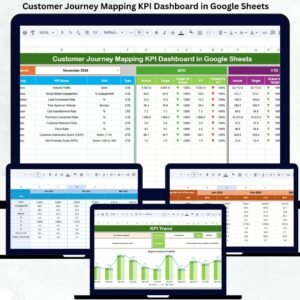
📊 Dashboard Sheet — Your Complete Influencer Performance Hub
This is the main page where every key metric appears beautifully organized. Just choose a month in cell D3, and the dashboard refreshes instantly.
You can monitor:
-
Monthly KPI performance (MTD)
-
Yearly KPI performance (YTD)
-
Target vs Actual
-
Actual vs Previous Year
-
Trend indicators with up/down arrows
Everything is color-coded for quick interpretation, helping you instantly identify performance gaps and growth opportunities.
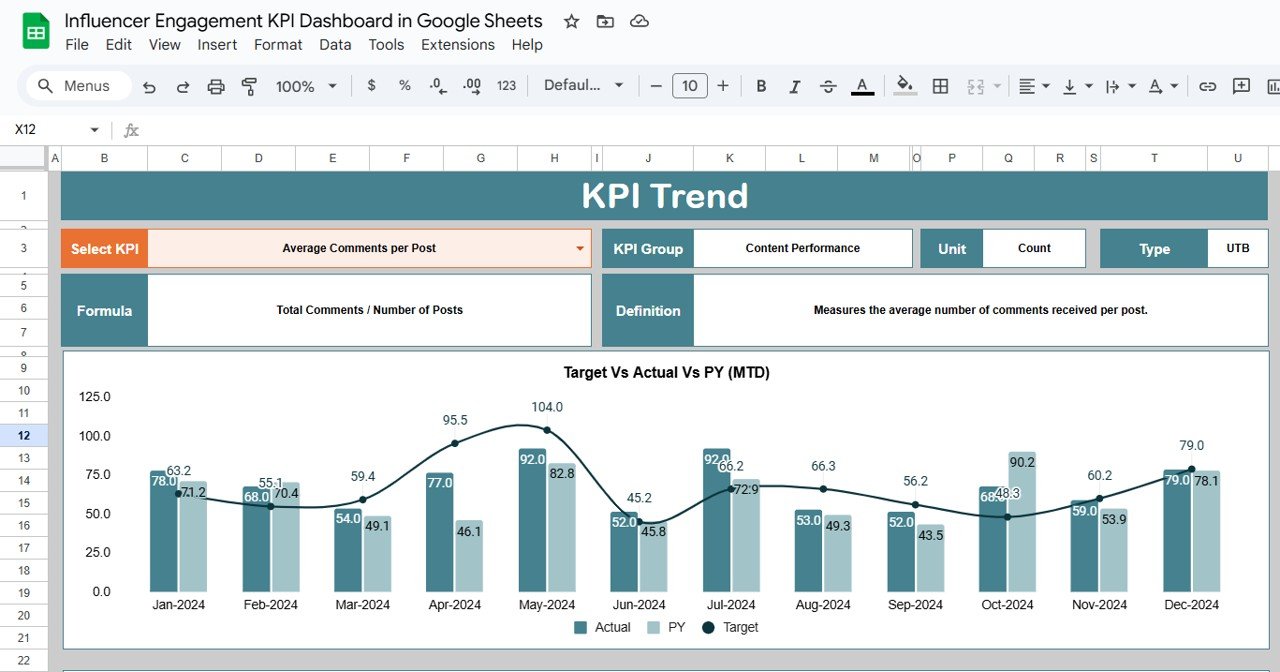
📈 KPI Trend Sheet — Deep-Dive KPI Analysis
This sheet reveals the full story behind each KPI. Simply select a metric from cell C3, and the dashboard automatically displays:
-
KPI Group
-
KPI Unit
-
KPI Type (UTB or LTB)
-
KPI Formula
-
KPI Definition
It also includes:
-
MTD Trend Chart – month-by-month influencer performance
-
YTD Trend Chart – full-year comparison vs target and previous year
This helps you understand seasonality, audience behavior, and creator effectiveness.
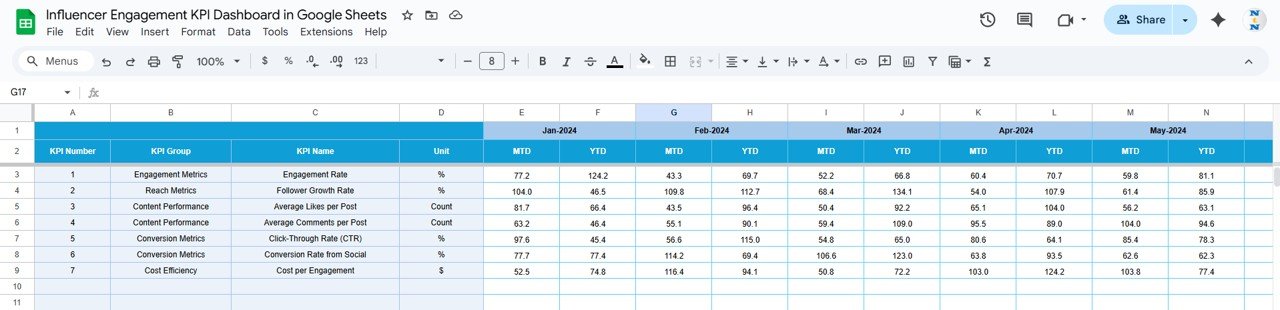
🧮 Actual Number Sheet — Enter Real-Time Data
This sheet stores:
-
Actual MTD values
-
Actual YTD values
-
The first month of your fiscal year (cell E1)
This keeps your dashboard accurate and fully dynamic.
🎯 Target Sheet — Set KPI Goals Clearly
Define:
-
Monthly MTD targets
-
Monthly YTD targets
Setting clear targets makes it easy to evaluate if influencers performed above or below expectations.
📘 Previous Year Numbers Sheet — Historical Benchmarking
Store:
-
PY MTD values
-
PY YTD values
Year-over-year comparisons help you measure real improvement in influencer performance.
📑 KPI Definition Sheet — Master Reference Guide
This sheet includes every KPI with:
-
KPI Name
-
Group
-
Unit
-
Formula
-
Definition
-
Type (UTB or LTB)
It standardizes your influencer analytics and eliminates confusion within your team.
📦 What’s Inside the Influencer Engagement KPI Dashboard in Google Sheets
-
Automated monthly & yearly KPI dashboard
-
Accurate trend charts
-
Dynamic drop-down filters
-
Clean data entry sheets
-
KPI glossary with formulas
-
Historical and target comparison
-
Conditional formatting indicators
-
Cloud-based accessibility
-
Agency-friendly reporting layout
Everything is organized so marketers and decision-makers can get insights instantly without wasting time manually calculating metrics.
🛠️ How to Use the Influencer Engagement KPI Dashboard in Google Sheets
1️⃣ Input actual data regularly
Update MTD and YTD values in the Actual Sheet.
2️⃣ Set your monthly targets
Enter targets in the Target Sheet for each KPI.
3️⃣ Select the month
Choose any month from the dashboard drop-down to refresh the entire report.
4️⃣ Analyze trends
Use MTD/YTD charts to understand:
-
Growth patterns
-
Decline signals
-
Creator impact
-
Engagement spikes
5️⃣ Compare against last year
Spot improvements or drops using the PY sheet.
6️⃣ Customize as needed
Add more KPIs, adjust formulas, or modify visuals effortlessly.
👥 Who Can Benefit from This Dashboard
📣 Marketing Teams
Track campaign performance, influencer impact, and ROI easily.
💼 Agencies
Share real-time dashboards with clients for transparent reporting.
🛒 E-Commerce Brands
Understand which influencers drive traffic and conversions.
📱 Influencer Managers
Compare multiple creators and allocate budgets smartly.
🎥 Content Creators
Analyze personal engagement trends and improve strategy.
The Influencer Engagement KPI Dashboard in Google Sheets is more than a reporting file—it is a complete influencer intelligence system. With structured worksheets, automated KPIs, strong trend analysis, and cloud-based collaboration, it helps brands identify top performers, optimize campaigns, and scale influencer marketing with confidence.
Click Here to Read the Detailed Blog Post
Watch the step-by-step video Demo:


Reviews
There are no reviews yet.