In today’s competitive business environment, managing your workforce effectively is the foundation of organizational success. The Human Resources (HR) KPI Dashboard in Excel is a ready-to-use and interactive tool that helps HR leaders monitor key employee metrics, visualize performance, and make smarter, data-driven decisions — all within one simple Excel file.
Whether you lead a small HR department or manage a multi-branch enterprise, this dashboard provides a 360-degree view of your team’s performance — from hiring and training to engagement and retention. It’s intuitive, visually appealing, and completely customizable to your organization’s needs.Human Resources (HR) KPI Dashboard in Excel
✨ Key Features of the Human Resources (HR) KPI Dashboard in Excel
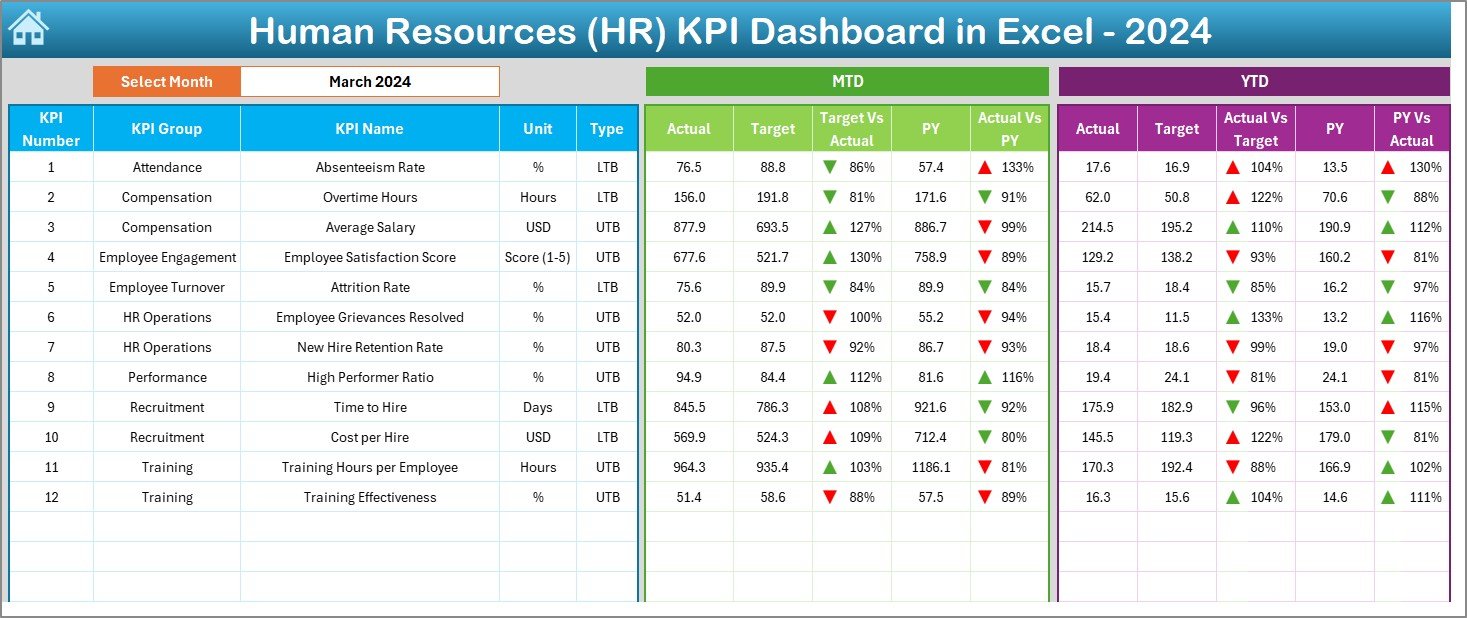
✅ Interactive Dashboard View – Analyze Month-to-Date (MTD) and Year-to-Date (YTD) KPIs using dropdown filters that refresh automatically.
✅ Conditional Formatting – Instantly spot trends with green and red arrows that highlight improvement or decline.
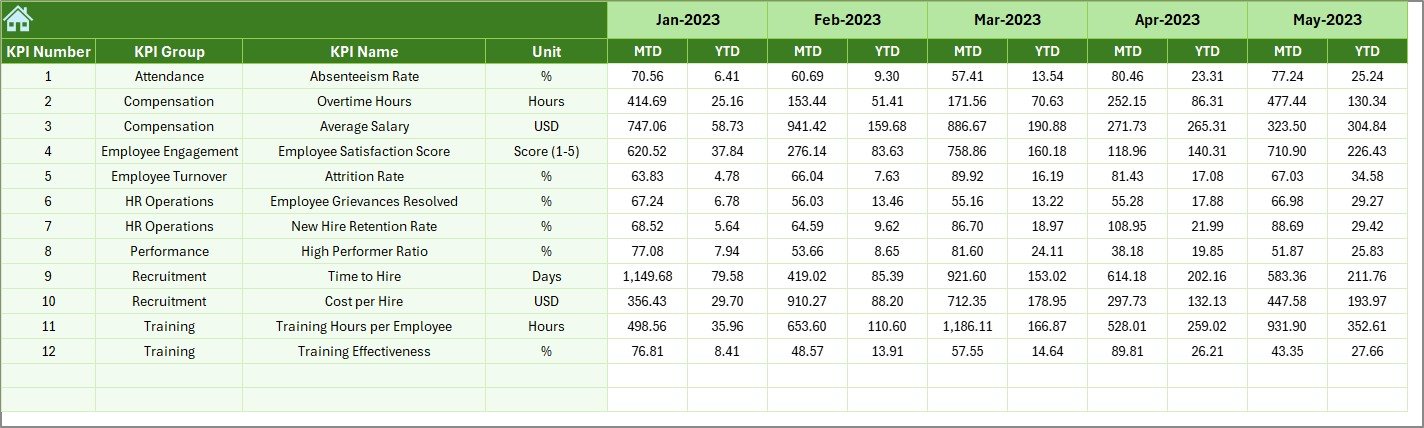
✅ Performance Comparison – Compare actual results against targets and previous-year data.
✅ User-Friendly Navigation – Six navigation buttons in the Home sheet make switching between pages effortless.
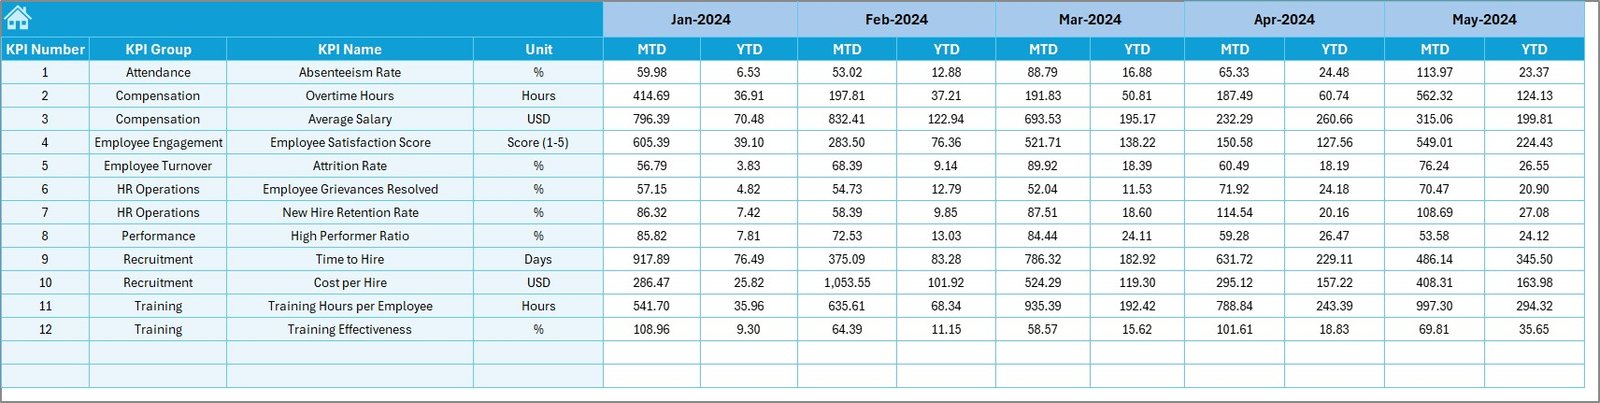
✅ Dynamic Charts & Tables – Visualize key metrics such as Employee Turnover, Satisfaction Score, and Training Hours.
✅ Ready for Customization – Modify KPIs, formulas, and visuals to suit your organization’s structure.
✅ Time-Saving Automation – Update data once and the entire dashboard recalculates automatically.
📊 What’s Inside the Human Resources (HR) KPI Dashboard in Excel
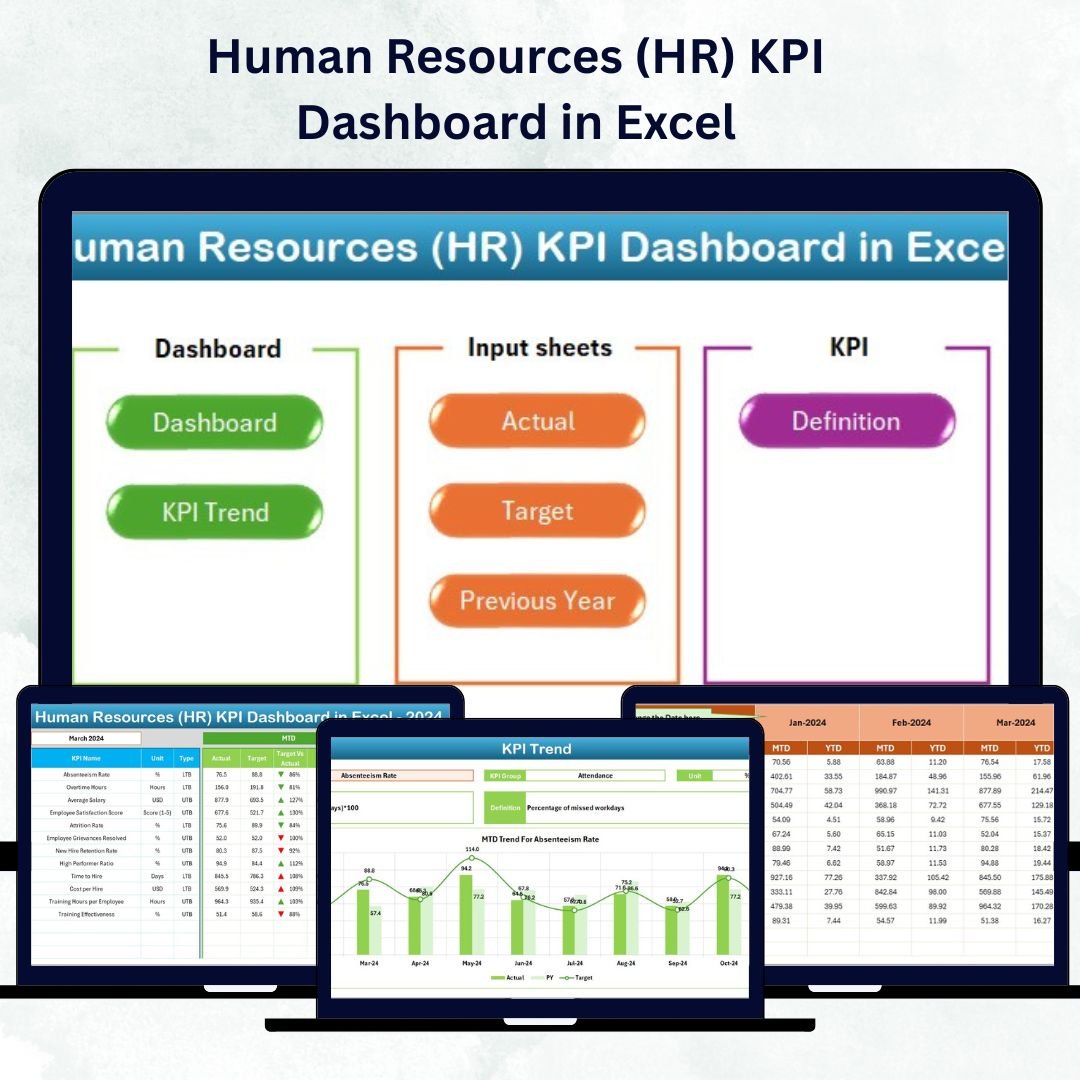
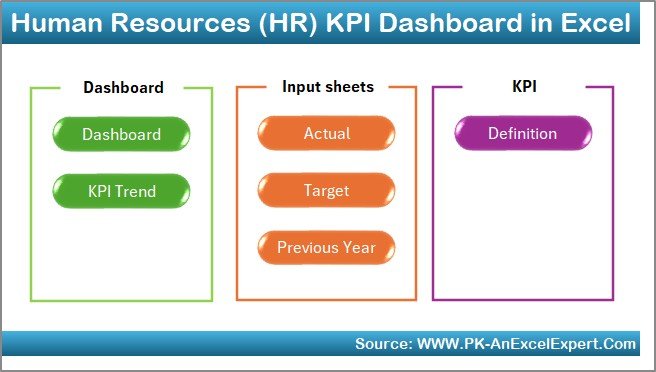
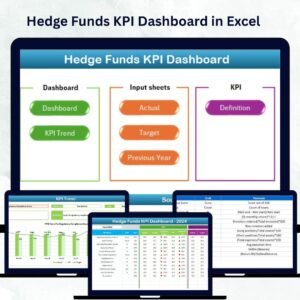
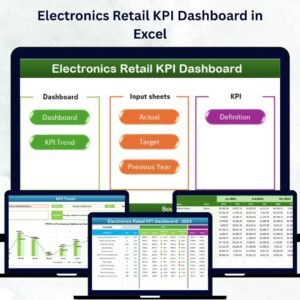
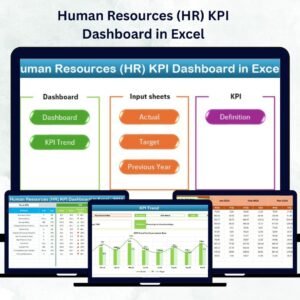
The template is structured into seven intelligent worksheet tabs:
1️⃣ Home Sheet – Acts as a command center with quick navigation buttons.
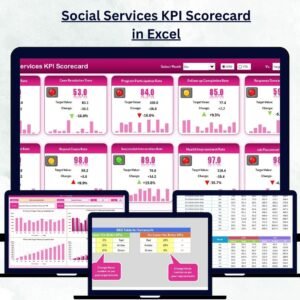
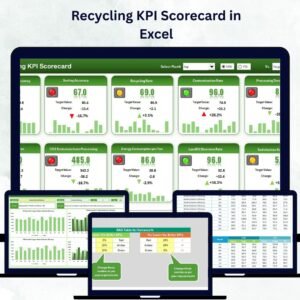
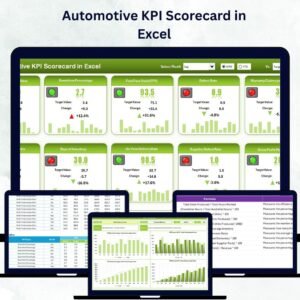
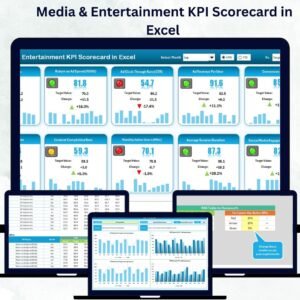
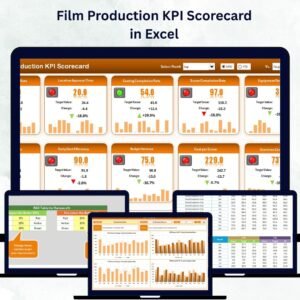
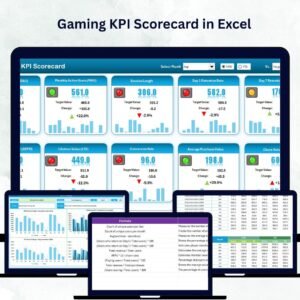
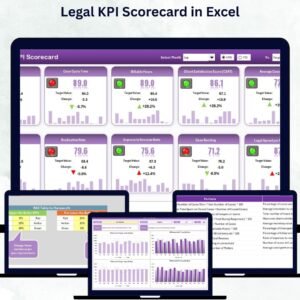
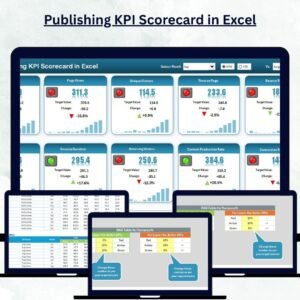
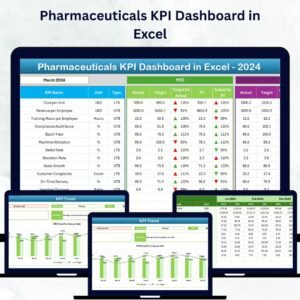
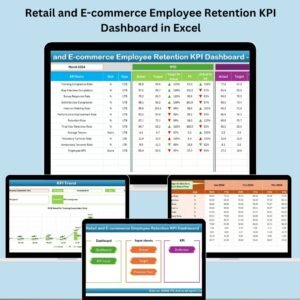
2️⃣ Dashboard Sheet – Displays visual charts, summary cards, and KPI tables for instant insights.
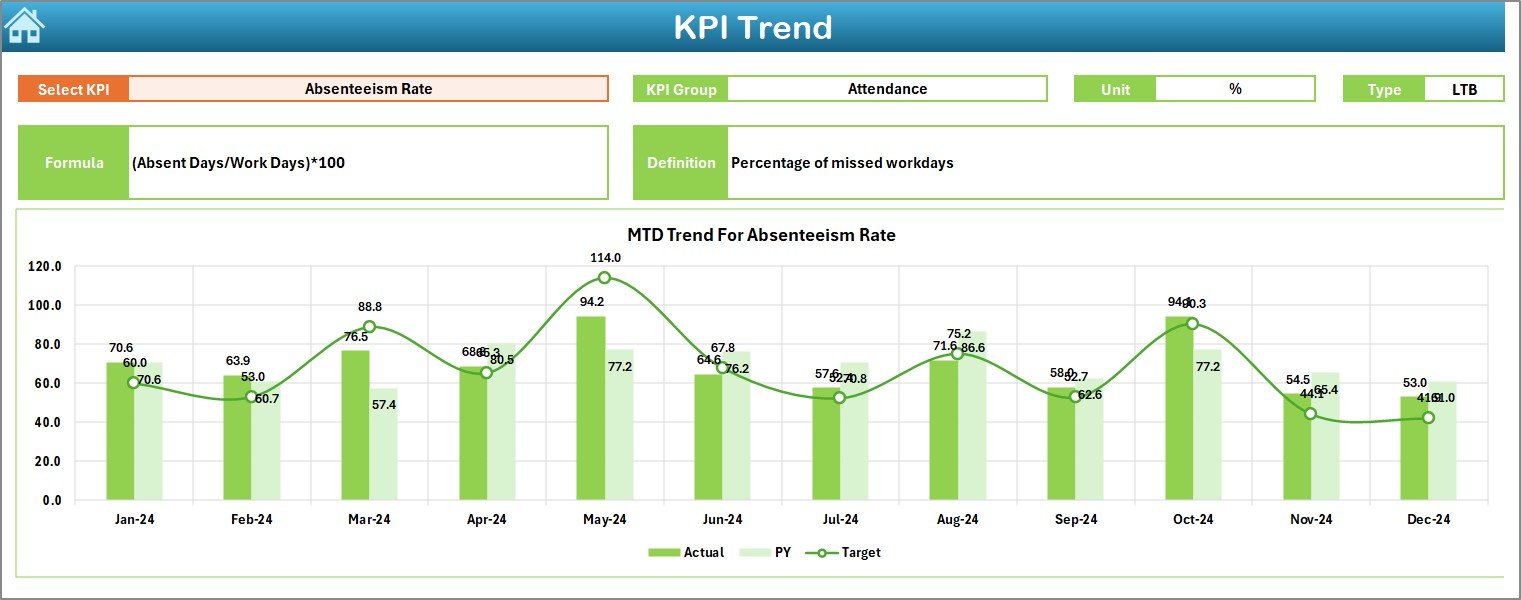
3️⃣ KPI Trend Sheet – Choose any KPI to view monthly trends with Actual, Target, and Previous-Year comparisons.
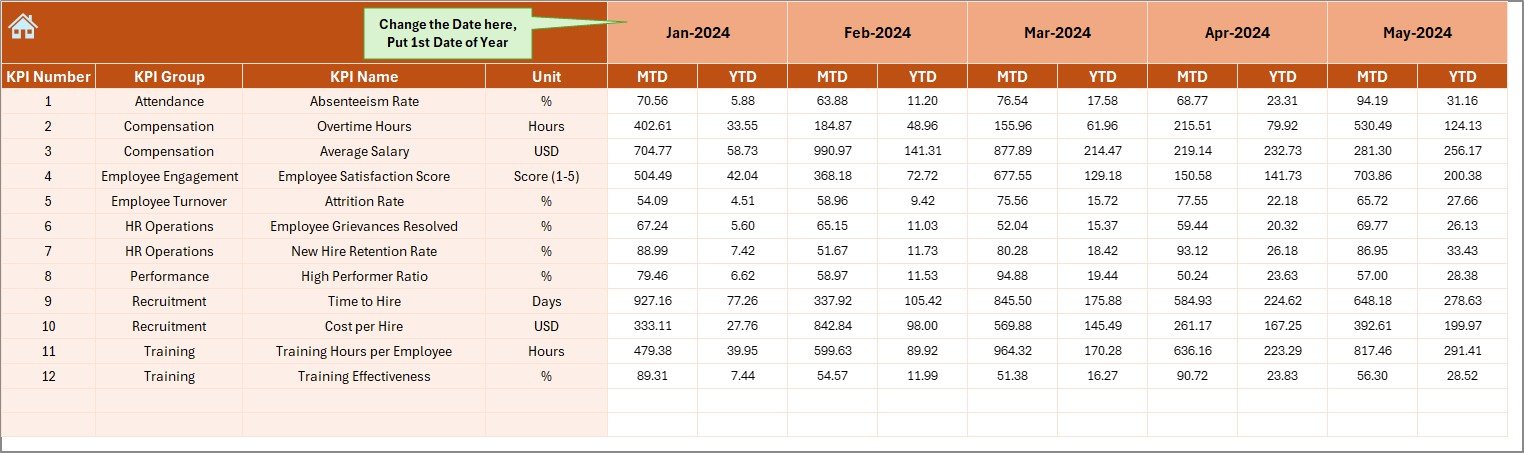
4️⃣ Actual Numbers Input Sheet – Update MTD and YTD data easily with a single month selection in cell E1.
5️⃣ Target Sheet – Define monthly and yearly KPI goals to measure success.
6️⃣ Previous Year Sheet – Store and compare historical data to track growth over time.
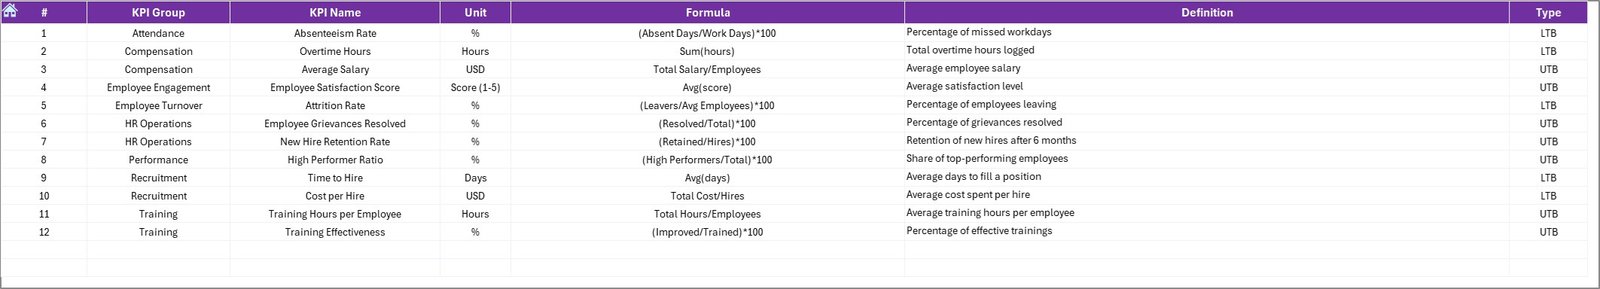
7️⃣ KPI Definition Sheet – Includes KPI Name, Group, Unit, Formula, and Definition for reference.
Each sheet works in sync, ensuring accurate calculations and professional-grade reporting — without writing a single formula.
⚙️ How to Use the Human Resources (HR) KPI Dashboard in Excel
🚀 Step 1: Start on the Home Sheet and explore the available navigation buttons.
📈 Step 2: Go to the Target Sheet and define performance goals for every KPI.
🧮 Step 3: Enter actual performance data in the Actual Numbers Input Sheet each month.
🔁 Step 4: Update the Previous Year Sheet to compare last year’s results.
📊 Step 5: Review KPI trends in the KPI Trend Sheet using the dropdown filter (cell C3).
📅 Step 6: Use the Dashboard Sheet to view MTD/YTD visuals and identify improvement areas instantly.
Within minutes, HR professionals can generate complete performance summaries and share them across the organization.
👩💼 Who Can Benefit from This HR KPI Dashboard in Excel
💼 HR Managers – Track workforce productivity, absenteeism, and employee engagement.
🏢 Business Leaders – Make strategic staffing and budgeting decisions with confidence.
🧑🏫 Training Managers – Measure learning hours and skill-development progress.
🏭 Manufacturing or Service Companies – Analyze shift management, labor productivity, and compliance.
🏫 Educational Institutions – Evaluate teaching and administrative performance.
🚀 Startups – Gain visibility into recruitment speed and cultural health without expensive tools.
Anyone who values data-driven HR management will benefit from this dashboard’s simplicity and power.


Reviews
There are no reviews yet.