Managing human resources effectively requires data-driven insights. The HR Dashboard in Power BI provides a powerful, visual, and interactive solution that helps HR professionals track workforce metrics, monitor employee engagement, and optimize performance — all within one integrated platform.
Built using Microsoft Power BI and powered by Excel data, this ready-to-use dashboard centralizes everything from turnover and retention to training hours and performance scores. It enables HR teams to make informed decisions faster while reducing manual reporting.
⚙️ Key Features of the HR Dashboard in Power BI
The dashboard includes five analytical pages, each designed to analyze a specific aspect of workforce performance.
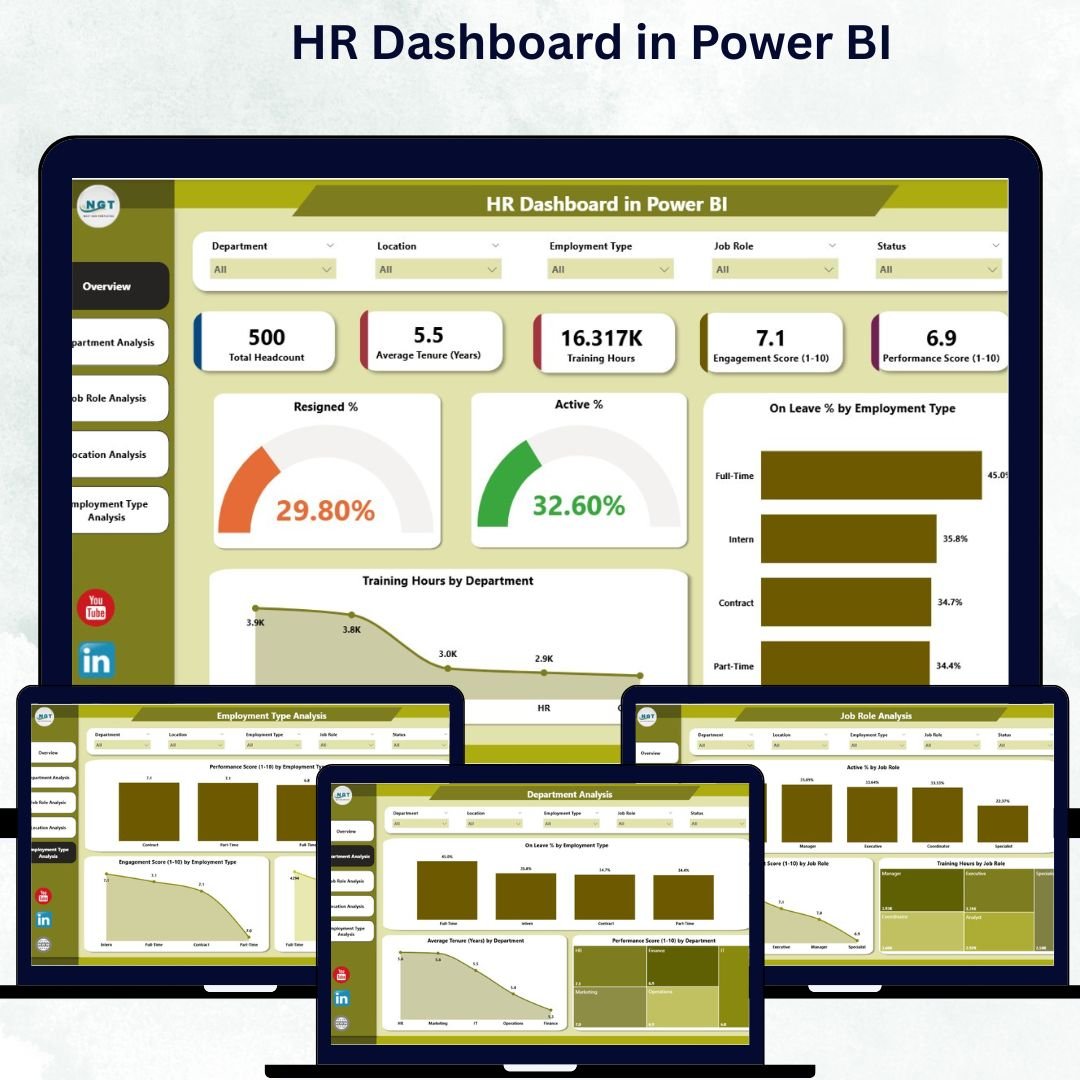
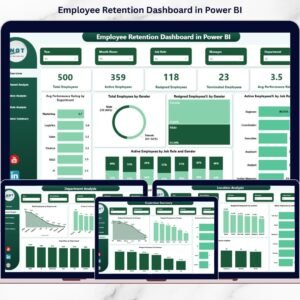
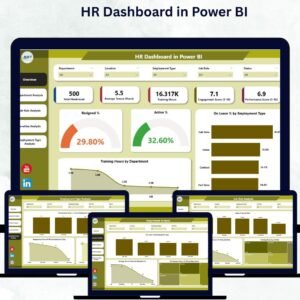
🧭 1️⃣ Overview Page – The Command Center
The Overview Page offers a real-time summary of key HR indicators.

Key Highlights:
-
KPI Cards:
-
Resigned %
-
Active %
-
On Leave %
-
-
Charts:
-
Employee Type Distribution
-
Training Hours by Department
-
-
Dynamic Slicers: Filter by Department, Job Role, or Location.
With this view, HR leaders can instantly assess workforce health and identify areas that require immediate attention.
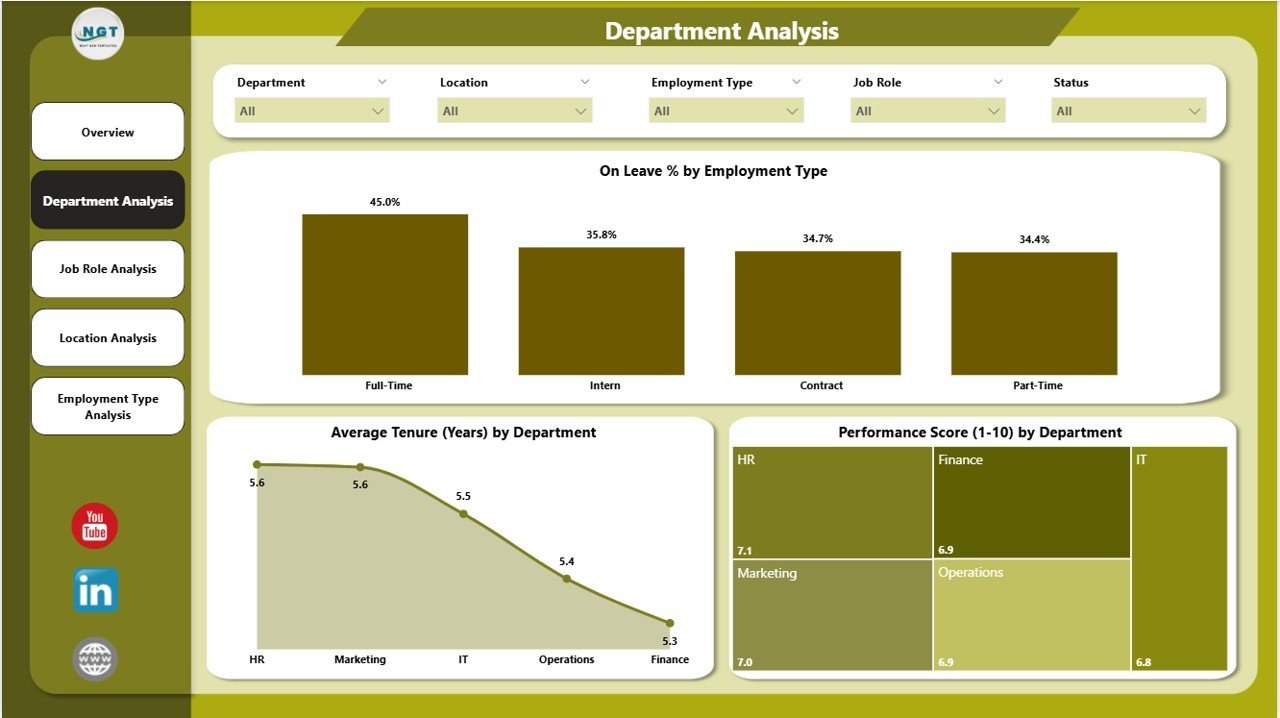
🏢 2️⃣ Department Analysis – Evaluate Team Performance
Dive deeper into how each department performs.
Visuals Include:
-
On Leave % by Employee Type
-
Average Tenure (Years) by Department
-
Performance Score (1–10) by Department
This page helps HR identify which departments excel, which need better retention strategies, and how performance trends differ across divisions.
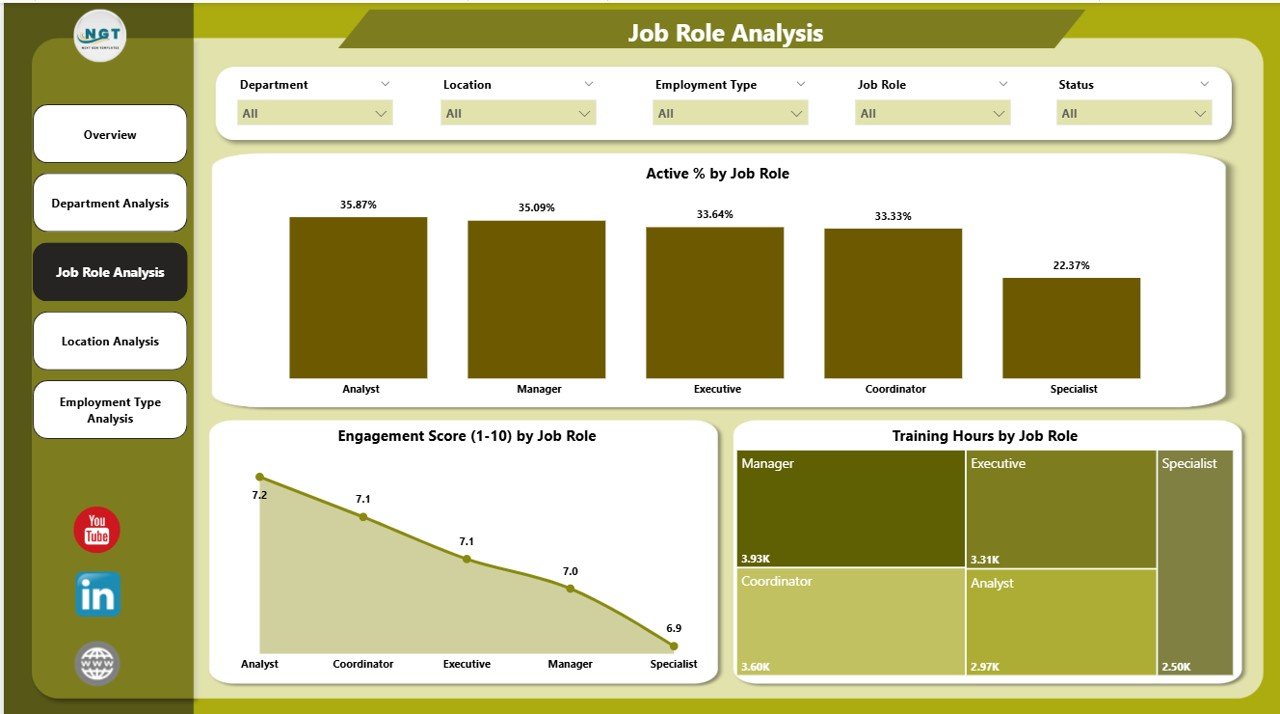
👩💼 3️⃣ Job Role Analysis – Role-Specific Insights
The Job Role Analysis Page examines engagement and performance at a job role level.
Charts Include:
-
Active % by Job Role
-
Engagement Score (1–10) by Job Role
-
Training Hours by Job Role
HR teams can use these insights to improve training programs, manage workload distribution, and enhance role-specific engagement.
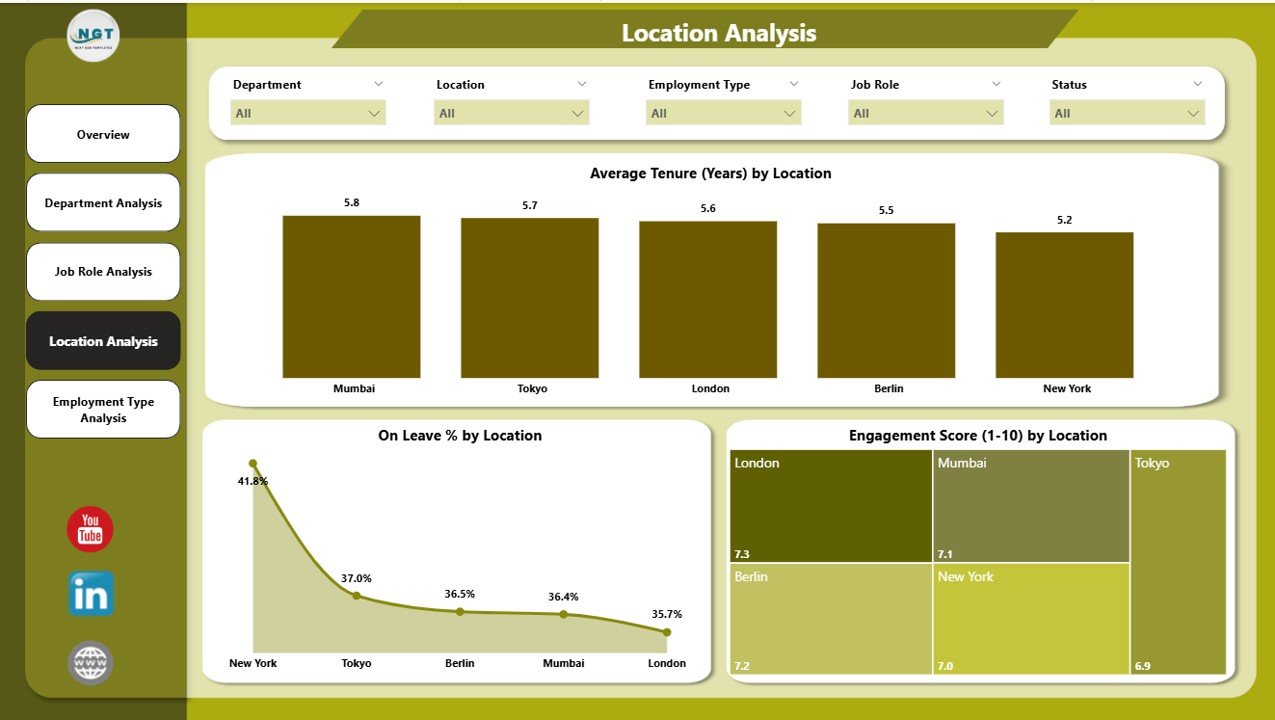
🌍 4️⃣ Location Analysis – Compare Workforce Across Offices
Ideal for organizations with multiple branches, this page provides a geographical lens into HR data.
Visuals Include:
-
Average Tenure (Years) by Location
-
On Leave % by Location
-
Engagement Score (1–10) by Location
By analyzing these visuals, HR leaders can identify underperforming regions and tailor initiatives to improve culture and retention.
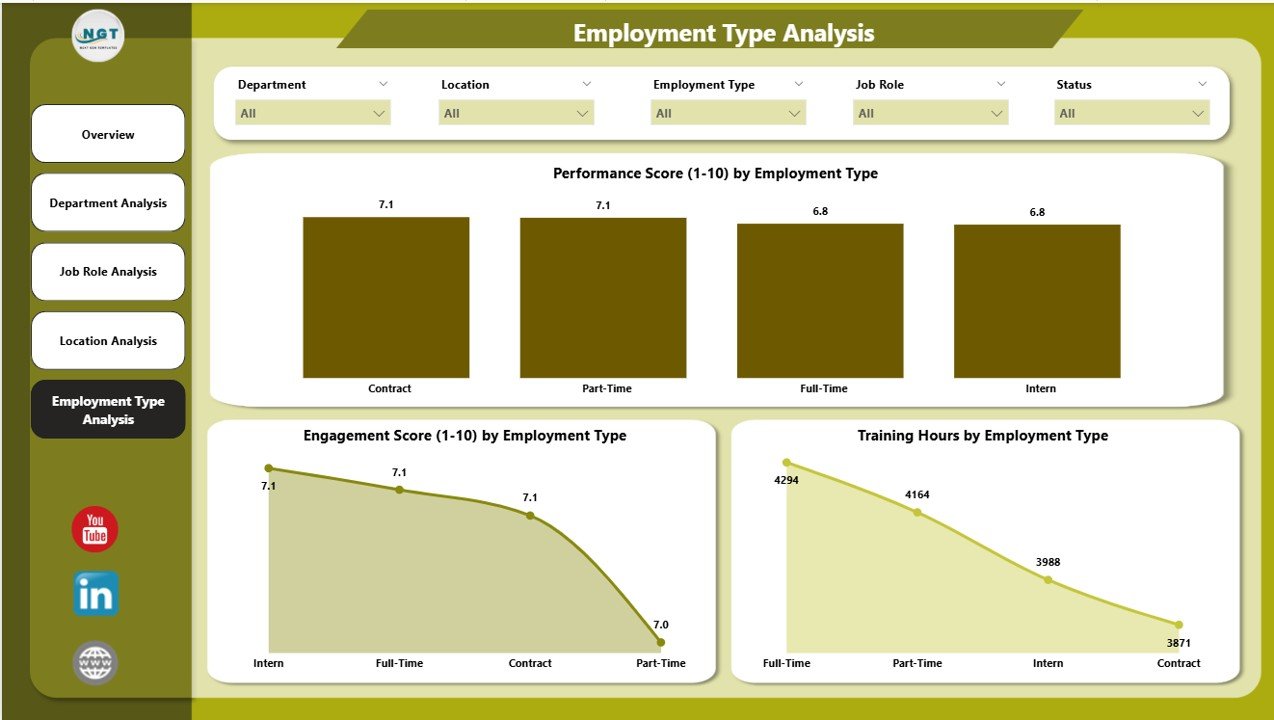
💼 5️⃣ Employment Type Analysis – Workforce Composition Insights
The Employment Type Analysis Page tracks metrics across different employment categories.
Charts Include:
-
Performance Score (1–10) by Employment Type
-
Engagement Score (1–10) by Employment Type
-
Training Hours by Employment Type
This page helps HR design tailored programs for full-time, part-time, contract, and intern employees.
🧩 Data Source – Excel Integration
The HR Dashboard pulls data directly from Excel files or HRMS exports. Common fields include:
| Employee ID | Department | Job Role | Location | Tenure | Training Hours | Engagement Score | Performance Score | Status |
Once the Excel file is connected, Power BI automatically updates the visuals.
🌟 Why Every Organization Needs the HR Dashboard in Power BI
In a competitive business environment, HR teams can’t rely on static spreadsheets. The HR Dashboard in Power BI transforms HR data into live analytics, enabling smarter decisions across recruitment, engagement, and retention.
Key Benefits:
✅ Real-Time Data Refresh – Always stay up to date with the latest information.
✅ Interactive Visuals – Drill down into departments, roles, and employee types.
✅ Centralized Intelligence – All HR data consolidated into one platform.
✅ Seamless Integration – Connects easily with Excel, HRMS, and payroll systems.
✅ Data-Driven Strategy – Identify attrition risks, engagement gaps, and growth opportunities.
🧠 Use Cases
📊 Recruitment Analysis: Track hiring trends, time-to-hire, and top-performing recruiters.
🧾 Retention Monitoring: Detect turnover spikes and underlying causes.
💬 Engagement Tracking: Compare engagement scores by location or role.
🎯 Performance Evaluation: Measure department-level achievements.
📚 Learning & Development: Assess training hours and participation effectiveness.
💡 How to Build & Use the Dashboard
1️⃣ Prepare Data: Collect employee data in Excel with consistent headers.
2️⃣ Import Data: Load into Power BI using “Get Data.”
3️⃣ Transform Data: Use Power Query to clean and format.
4️⃣ Create Relationships: Connect tables (employee, department, etc.).
5️⃣ Design Pages: Add charts and KPI cards for each focus area.
6️⃣ Apply Filters & Slicers: Enable dynamic interactivity.
7️⃣ Publish: Share the dashboard via Power BI Service.
🔍 Advantages of Using Power BI for HR Analytics
✔️ Automates Reporting – No manual data consolidation.
✔️ Improves Transparency – Clear visual storytelling of HR performance.
✔️ Enhances Retention – Spot patterns of disengagement early.
✔️ Promotes Accountability – Department-wise metrics visible to leaders.
✔️ Saves Time – Simplifies analysis with automated refresh and drill-throughs.
✔️ Scalable – Adaptable to any organization size or HR structure.
⚙️ Best Practices
✅ Focus on key metrics (6–8 visuals per page).
✅ Use color consistency across departments.
✅ Schedule automatic data refreshes.
✅ Protect sensitive HR information via role-level security.
✅ Regularly review and update KPIs to match company goals.
💬 Real-Life Example
A healthcare firm noticed low engagement in one branch. The Location Analysis Page revealed low training participation. HR introduced more training programs and communication channels — within two months, engagement improved by 25%.
That’s how Power BI transforms HR analytics from reactive to proactive.
🎯 Conclusion
The HR Dashboard in Power BI empowers HR professionals to visualize employee trends, track performance, and optimize workforce management with ease. It unifies HR data into one interactive platform — helping teams make data-backed decisions that enhance engagement, retention, and overall productivity.
Whether you’re an HR manager or executive, this dashboard is your one-stop solution for understanding people analytics at a glance.
🔗 Click here to read the Detailed Blog Post
🎥 Visit our YouTube channel for tutorials
🔗 YouTube.com/@PKAnExcelExpert


Reviews
There are no reviews yet.