Tracking performance in the home appliances industry is no longer optional—it is essential. Sales targets, operational efficiency, inventory movement, and year-over-year growth must be monitored continuously. However, when KPI data is scattered across multiple spreadsheets, emails, and reports, teams lose clarity. As a result, performance gaps remain hidden and decisions are delayed.
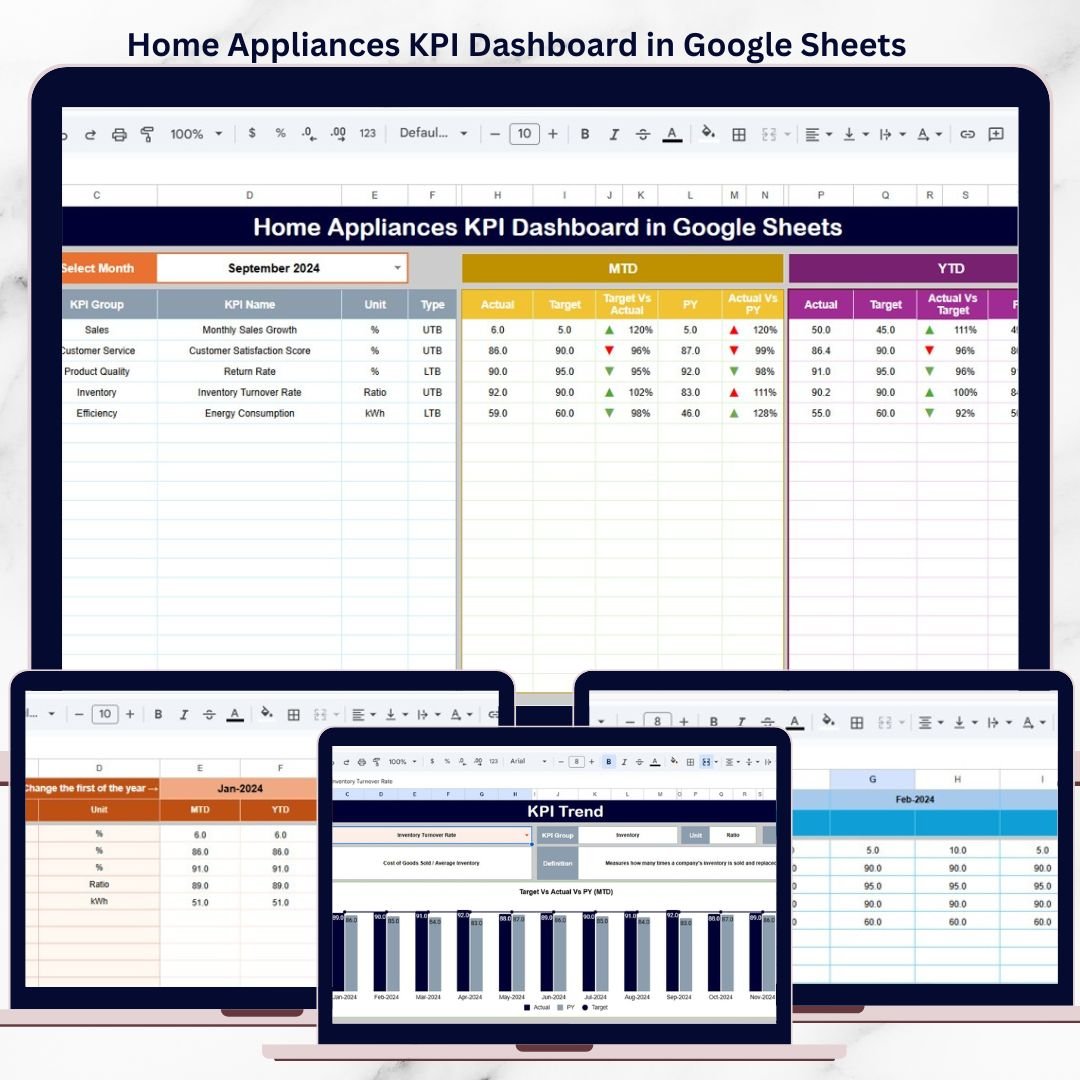
That is exactly why the Home Appliances KPI Dashboard in Google Sheets becomes a powerful, ready-to-use performance management solution.
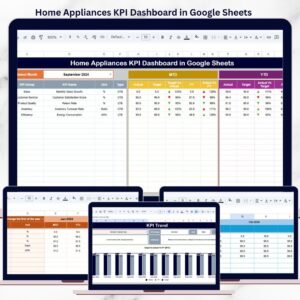
This professionally designed dashboard transforms raw KPI data into a clear, visual, and decision-ready scorecard. It allows sales teams, operations managers, analysts, and leadership to track monthly and yearly performance, compare targets, analyze previous year trends, and instantly identify problem areas using traffic lights and trend arrows.
Because the dashboard is built entirely in Google Sheets, it is cloud-based, easy to share, fully customizable, and requires no technical or BI expertise.
🚀 Key Features of Home Appliances KPI Dashboard
📅 Dynamic Month Selector
Change the reporting month from Cell D3, and the entire dashboard updates automatically.
📊 MTD & YTD Performance Tracking
Monitor both Month-to-Date and Year-to-Date performance for every KPI.
🎯 Target vs Actual Comparison
Instantly see how actual performance compares with planned targets.
🔄 Previous Year vs Current Year Analysis
Identify growth, decline, and seasonality using YoY comparison.
🚦 Traffic Lights & Trend Arrows
Red, Amber, and Green indicators combined with up/down arrows highlight performance health instantly.
📦 What’s Inside the Home Appliances KPI Dashboard
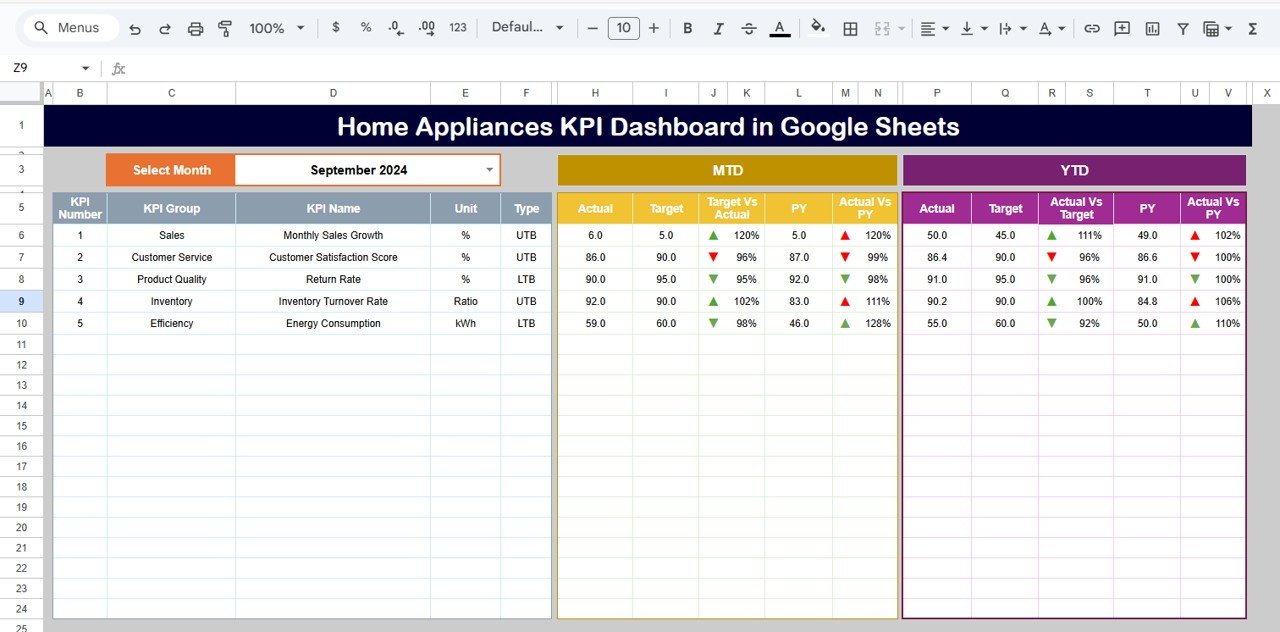
🖥️ Dashboard Sheet Tab (Main Sheet)
This is the executive-level performance overview.
It displays:
-
KPI Name
-
MTD Actual, Target & Previous Year values
-
Target vs Actual variance (%)
-
Previous Year vs Actual variance (%)
-
YTD Actual, Target & Previous Year values
-
Conditional formatting with arrows & traffic lights
This sheet is perfect for leadership reviews and monthly performance meetings.
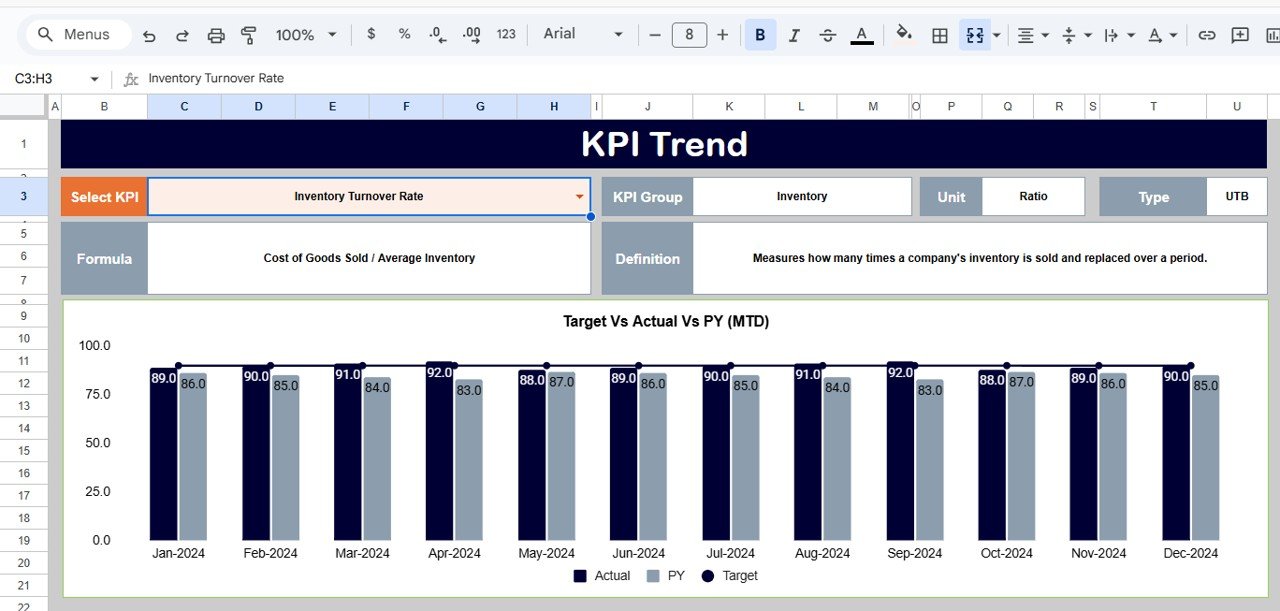
📈 KPI Trend Sheet Tab
This sheet enables deep KPI analysis.
How it works:
-
Select a KPI from the dropdown in Cell C3
-
Automatically displays:
-
KPI Group
-
KPI Unit
-
KPI Type (Lower the Better / Upper the Better)
-
KPI Formula
-
KPI Definition
-
Monthly trend values
-
It helps teams understand KPI behavior over time, not just final numbers.
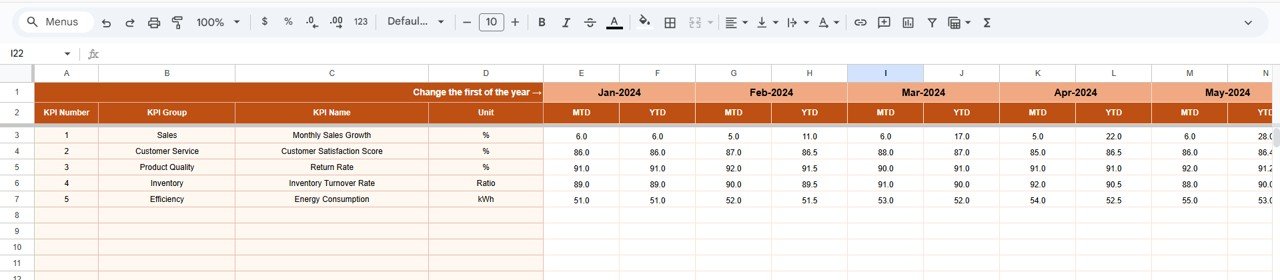
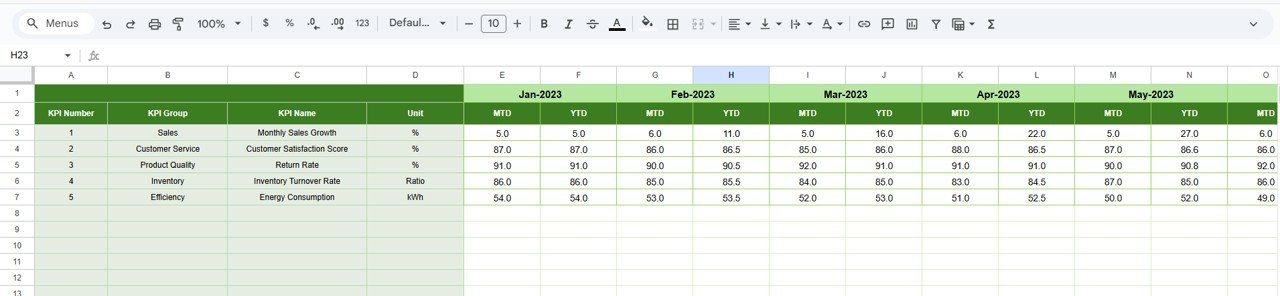
🧮 Actual Number Sheet Tab
This sheet is used for entering real performance data.
Key inputs:
-
Enter MTD and YTD actual values
-
Define the first month of the year in Cell E1
-
Monthly alignment happens automatically
Once data is updated, all dashboards and trend sheets refresh instantly.
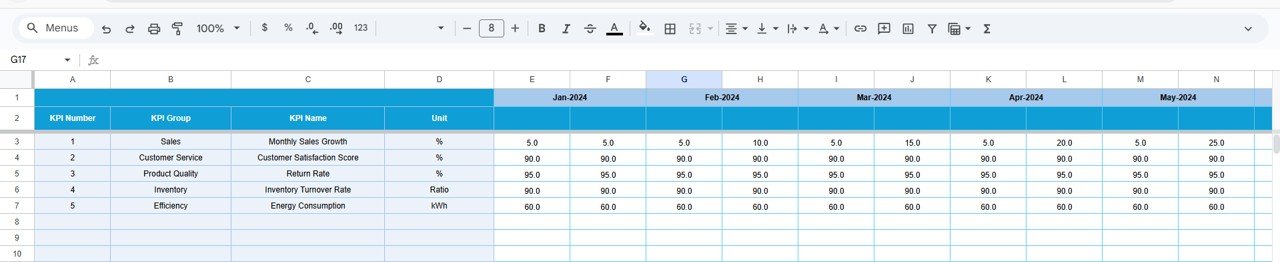
🎯 Target Sheet Tab
This sheet stores all performance goals.
You define:
-
Monthly (MTD) targets
-
Yearly (YTD) targets
-
KPI-wise benchmarks
This ensures consistent and measurable performance tracking.
📊 Previous Year Number Sheet Tab
This sheet captures last year’s KPI data.
Purpose:
-
Enable Year-over-Year analysis
-
Drive PY vs Actual variance calculations
-
Identify growth or decline patterns
The structure matches current year data for accuracy.
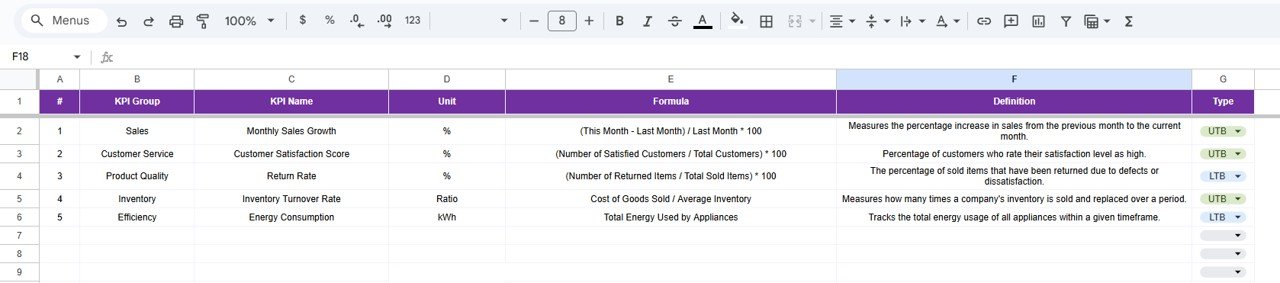
📘 KPI Definition Sheet Tab
This is the backbone of the dashboard.
It contains:
-
KPI Name
-
KPI Group (Sales, Operations, Finance, Supply Chain, etc.)
-
Unit (%, Units, Revenue, Days, Count)
-
KPI Formula
-
KPI Definition
-
KPI Type (LTB / UTB)
It ensures transparency, consistency, and audit readiness.
🎯 Who Can Benefit from This Dashboard
-
🏭 Home Appliance Manufacturers
-
🛒 Sales & Operations Teams
-
🚚 Retail & Distribution Managers
-
📊 Business Analysts
-
👔 Senior Management & Leadership Teams
Any organization involved in home appliance sales or operations can use this dashboard effectively.
### Click here to read the Detailed blog post
Watch the step-by-step video tutorial:


Reviews
There are no reviews yet.