


🏥 The healthcare industry is changing rapidly, and data is at the heart of every decision. From patient care to cost control, administrators need real-time insights to improve efficiency and outcomes. But managing thousands of patient records, treatments, and costs without a structured system can be overwhelming.
That’s where the Healthcare Services Dashboard in Excel 💡 comes in.
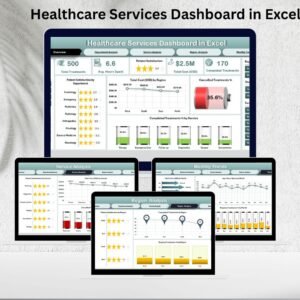
This ready-to-use dashboard brings together all critical healthcare data into one easy-to-understand, visual platform. Built in Microsoft Excel, it eliminates manual reporting struggles and delivers actionable insights through charts, KPIs, and tables. Whether you manage a hospital, clinic, or regional network, this dashboard empowers you to make faster, smarter, and data-driven decisions.
🌟 Key Features of Healthcare Services Dashboard in Excel

-
📊 Overview Page: A bird’s-eye summary with cards showing total patients, costs, satisfaction %, completed treatments, and cancelled treatments. Includes charts like Patient Satisfaction by Department and Treatment Completion % by Service.
-
🏥 Department Analysis: Dive deep into departmental performance. Track costs, average hours, and cancelled treatments % by department to identify strengths and weaknesses.
-
💉 Service Analysis: Evaluate healthcare services individually. See patient satisfaction, costs, and cancellations by service (e.g., surgery, emergency, consultations).
-
🌍 Region Analysis: Perfect for large healthcare networks—compare satisfaction, completed treatments, and ongoing cases by region.
-
📆 Monthly Trends: Spot seasonal patterns and long-term performance. Analyze costs, average hours, and ongoing treatments % by month.
-
⚡ Support Sheet: Backend data storage ensures smooth performance while keeping the front-end dashboard clean and professional.
📦 What’s Inside the Healthcare Services Dashboard
When you download this product, you’ll receive:
-
✅ A pre-designed Excel dashboard with 5 main analysis pages + 1 support sheet.
-
✅ Interactive charts and KPIs for costs, satisfaction, and treatments.
-
✅ Built-in slicers, conditional formatting, and structured data models.
-
✅ A scalable framework that works for small clinics or large hospitals.
-
✅ A customizable setup so you can add or remove KPIs based on your needs.
Everything is prebuilt—you just enter your data and start analyzing!
🛠 How to Use the Healthcare Services Dashboard
-
Update Data: Enter treatment, patient, and cost details into the support sheet.
-
Navigate Pages: Move across Overview, Department, Service, Region, and Trends pages to analyze performance.
-
Filter Results: Apply slicers to focus on specific timeframes, departments, or regions.
-
Review KPIs: Compare completed vs. cancelled treatments, satisfaction rates, and costs.
-
Spot Trends: Use the Monthly Trends page to identify seasonal fluctuations or recurring challenges.
-
Take Action: Use real-time insights to improve patient satisfaction, reduce costs, and optimize resources.
No coding or special tools needed—just Excel! 💻
👥 Who Can Benefit from This Dashboard
This dashboard is ideal for:
-
🏥 Hospital Administrators: Monitor costs, patient care, and department efficiency.
-
👨⚕️ Doctors & Clinic Managers: Track treatment completions, cancellations, and patient satisfaction.
-
🌐 Regional Healthcare Networks: Compare performance across multiple branches or locations.
-
📊 Policymakers & Government Agencies: Use reliable data for planning and decision-making.
-
💼 Small Clinics & Large Hospitals: Scalable enough to fit organizations of any size.
If you’re aiming to improve patient care, resource allocation, and operational efficiency, this tool is your ultimate solution.


Reviews
There are no reviews yet.