


Managing healthcare data has never been easier with the Healthcare Dashboard in Excel. Whether you’re tracking patient statistics, treatment costs, or doctor performance, this template offers a comprehensive solution for healthcare providers to organize, track, and analyze critical metrics. With built-in charts and slicers, this dashboard enables professionals to make data-driven decisions to improve patient care and operational efficiency. It’s a time-saving and cost-effective tool for healthcare facilities of all sizes.

🔑 Key Features of the Healthcare Dashboard:
-
Centralized Data Management: All key metrics are stored in one place, eliminating the need for multiple spreadsheets or software.
-
Easy Data Analysis: Pre-designed charts and slicers make it simple to track and analyze patient visits, revenue, treatment status, and satisfaction.
-
Real-Time Insights: The dashboard automatically updates as new data is entered, providing up-to-date performance data for healthcare teams.
-
Customizable: Tailor the dashboard to meet your specific needs—whether you’re focusing on patient satisfaction, revenue tracking, or doctor performance.
-
Cost-Effective: Unlike expensive healthcare management software, the Excel template is free, user-friendly, and requires no additional installations or training.
What’s Inside the Healthcare Dashboard in Excel? 📋🔍
This Healthcare Dashboard template consists of several worksheets, each designed to track a different aspect of healthcare data. Here’s a breakdown of each sheet and its key features:
-
Overview Sheet: The central hub of your dashboard where all critical metrics are displayed.
-
Cards: Track total patients, average visit cost, patient satisfaction, and ongoing treatment statuses.
-
Charts: Visualize patient data by insurance status, region, diagnosis, and more.
-
-
Financial Analysis Sheet: Focuses on tracking the financial performance of the healthcare facility.
-
Charts: Track revenue by diagnosis, treatment status, insurance status, and month.
-
Key Metrics: Helps you understand the financial health of your practice with easy-to-read visuals.
-
-
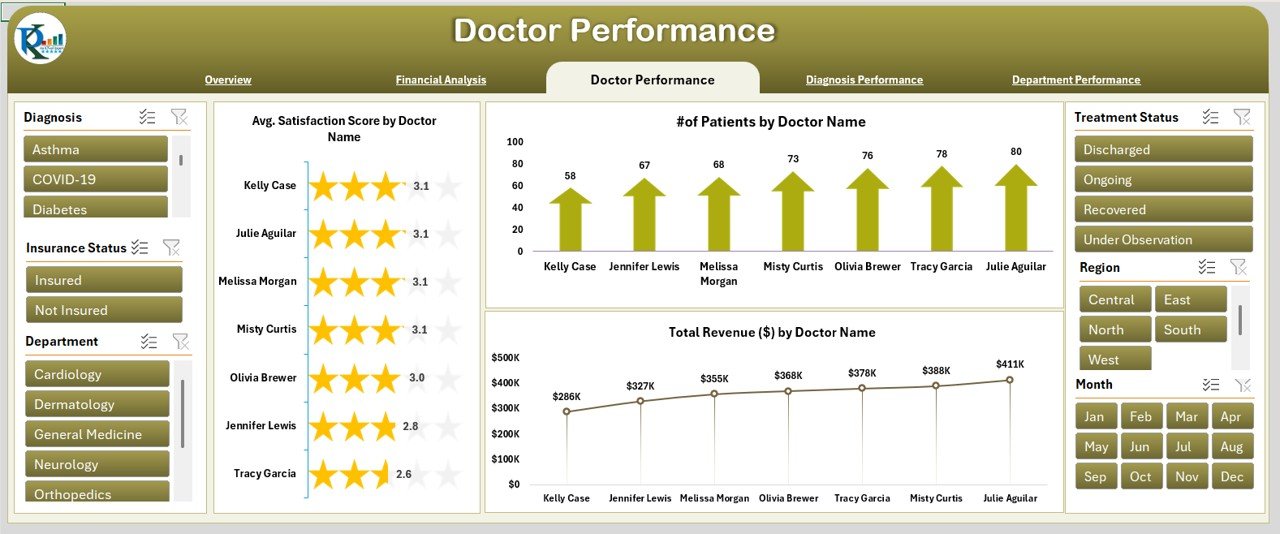
Doctor Performance Sheet: Tracks the performance of individual doctors.
-
Charts: Visualize the average satisfaction score, number of patients attended, and revenue generated by each doctor.
-
Metrics: Helps assess doctor performance, ensuring that the right resources are allocated where needed.
-
-
Diagnosis Performance Sheet: Focuses on the revenue and performance related to diagnoses.
-
Charts: See the number of patients by diagnosis and track revenue generated from each diagnosis type.
-
-
Department Performance Sheet: Tracks the performance of different hospital departments.
-
Charts: Visualize metrics like the number of patients served, average satisfaction scores, and revenue for each department.
-
Metrics: Provides insights to improve departmental efficiency and patient care.
-
-
Data Sheet: The backbone of the dashboard where raw data is inputted. It stores patient and treatment details, which feed the charts and other performance metrics.
How to Use the Healthcare Dashboard in Excel 📈💡
To get started with the Healthcare Dashboard, simply follow these steps:
-
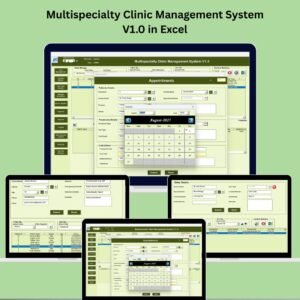
Download and Open the Template: Open the dashboard in Excel and get ready to input your data.
-
Input Your Data: Enter essential patient information, treatment costs, and doctor performance in the Data Sheet.
-
Track Metrics: Use the Overview Sheet to visualize key metrics and see how your practice is performing in real time.
-
Review Financials: Analyze revenue and financial performance in the Financial Analysis Sheet to monitor the fiscal health of your facility.
-
Monitor Trends: Use the Doctor Performance Sheet and Diagnosis Performance Sheet to track individual doctor and diagnosis performance over time.
-
Share and Collaborate: Share the dashboard with your team to ensure everyone is aligned and informed about performance metrics.
Who Can Benefit from This Healthcare Dashboard? 🏥💼
The Healthcare Dashboard in Excel is designed for healthcare providers, hospital administrators, and healthcare management teams who want to improve their operational efficiency, track key performance metrics, and enhance patient care.
-
Healthcare Providers: Track patient visits, treatment costs, and satisfaction metrics for better care delivery.
-
Hospital Administrators: Get a comprehensive view of the hospital’s financial performance and departmental efficiency.
-
Doctors and Care Teams: Evaluate individual performance metrics to improve service delivery and patient engagement.
-
Financial Managers: Monitor revenue trends and identify areas to optimize billing and insurance practices.
Advantages of Using the Healthcare Dashboard in Excel 💡📊
-
Centralized Data: Consolidates all critical metrics in one place, making it easier to track and analyze healthcare data.
-
Quick and Easy Analysis: With built-in slicers and charts, quickly visualize trends and identify areas for improvement.
-
Data-Driven Decision Making: Real-time insights allow you to make informed decisions about patient care, resource allocation, and financial planning.
-
Customizable for Your Needs: Tailor the template to fit your specific healthcare practice, including adding or removing charts or metrics as needed.
-
Cost-Effective: Unlike expensive software, this template is free and user-friendly, offering powerful reporting capabilities without the hefty price tag.


Reviews
There are no reviews yet.