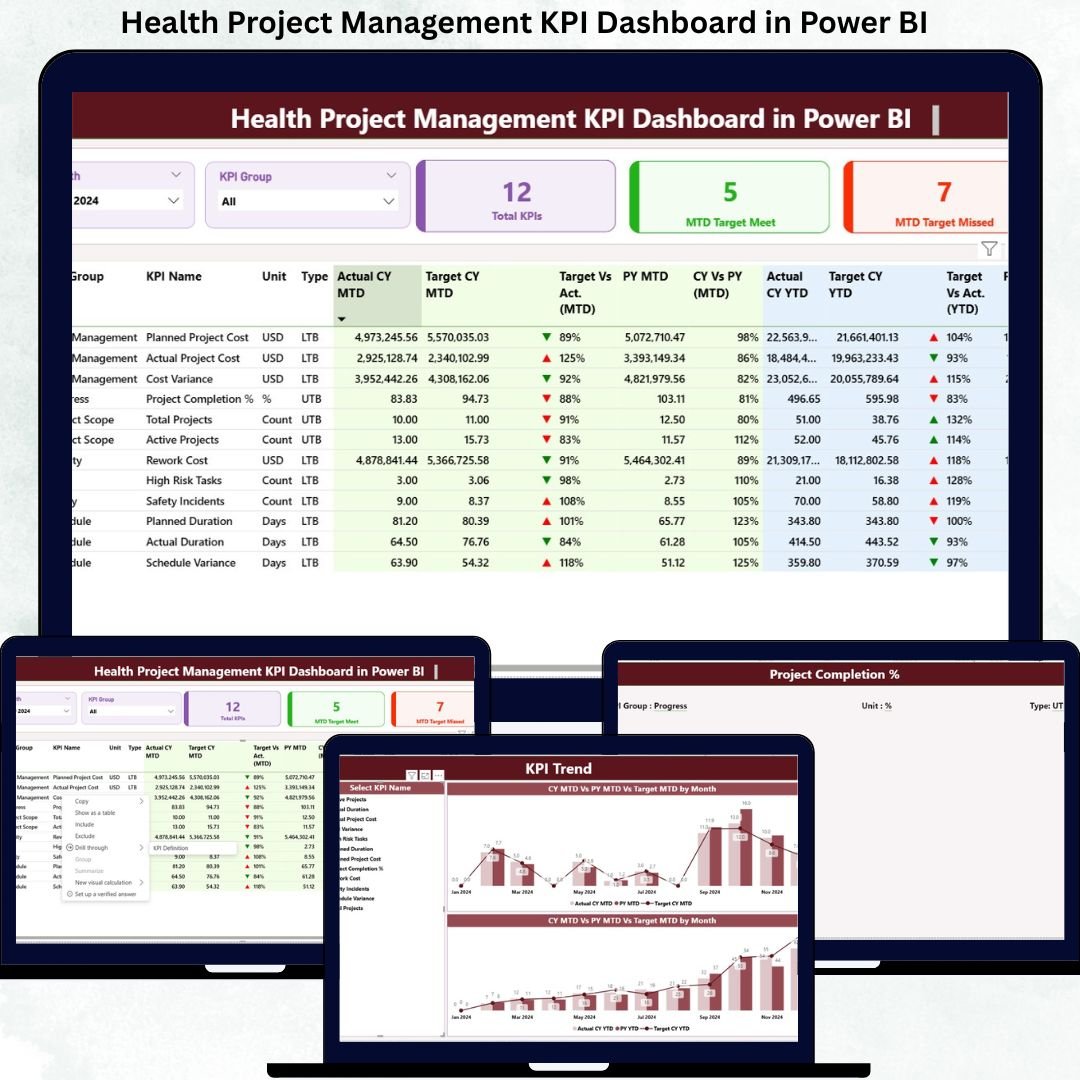
Managing healthcare projects requires accuracy, transparency, and real-time visibility. However, manual tracking using spreadsheets often leads to delays, inconsistencies, and poor decision-making. That’s exactly why the Health Project Management KPI Dashboard in Power BI is a must-have solution for healthcare organizations.
This professionally designed and ready-to-use dashboard helps you monitor project performance, analyze KPIs, track targets, and make data-driven decisions — all from a single interactive Power BI interface. Whether you manage hospital projects, healthcare programs, or operational initiatives, this dashboard gives you complete control with clarity and confidence.
🔹 Key Features of Health Project Management KPI Dashboard
✅ Interactive Power BI Dashboard – Visually rich and easy-to-use layout
✅ Excel-Based Data Input – Simple updates without technical complexity
✅ MTD & YTD Performance Tracking – Monitor monthly and yearly progress
✅ Target vs Actual Analysis – Instantly identify gaps
✅ Automated KPI Status Indicators – Green & red arrows for quick insights
✅ Dynamic Filters & Slicers – Analyze data by month and KPI group
✅ Trend Analysis Charts – Identify performance patterns
✅ Professional & Management-Ready Design – Ideal for presentations
📊 What’s Inside the Health Project Management KPI Dashboard
This Power BI dashboard consists of three powerful analytical pages, each designed for better decision-making.
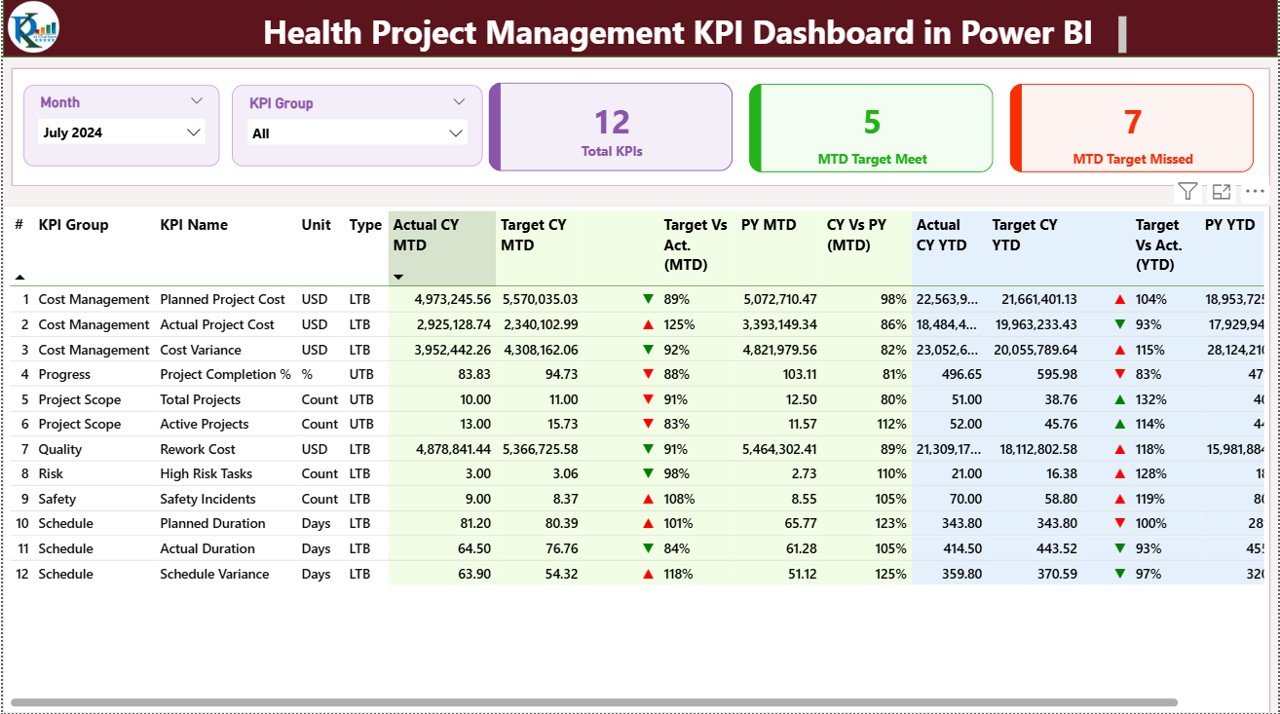
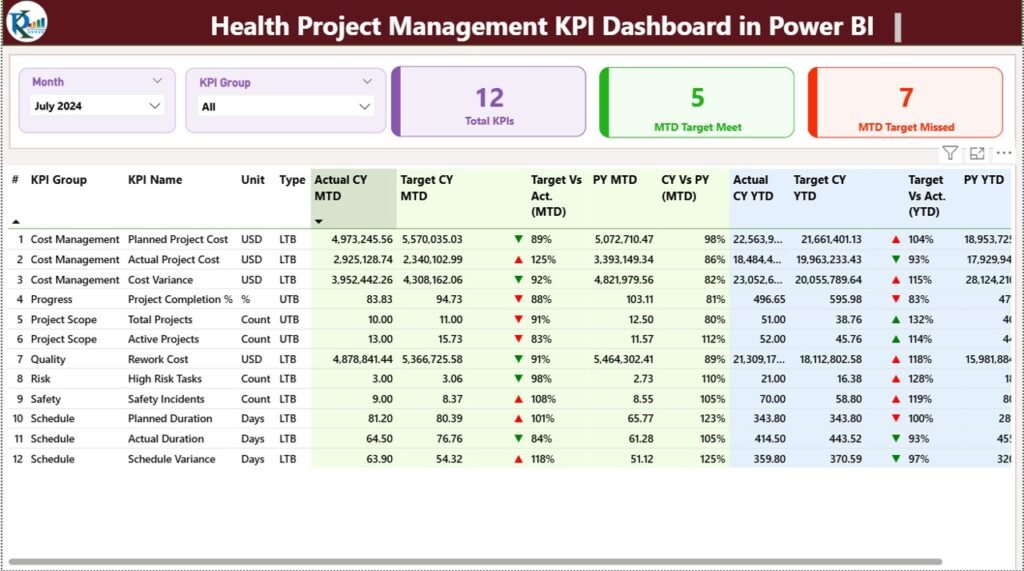
📌 1. Summary Page – Performance Overview
This is the main control panel of the dashboard.
✔ Month & KPI Group slicers for quick filtering
✔ KPI cards showing:
-
Total KPIs
-
MTD Target Met
-
MTD Target Missed
✔ Detailed KPI table with:
-
KPI Number
-
KPI Group & Name
-
Unit of Measurement
-
KPI Type (LTB / UTB)
-
Actual vs Target (MTD & YTD)
-
Performance Indicators
-
CY vs PY Comparison
This page provides an instant snapshot of overall project health.
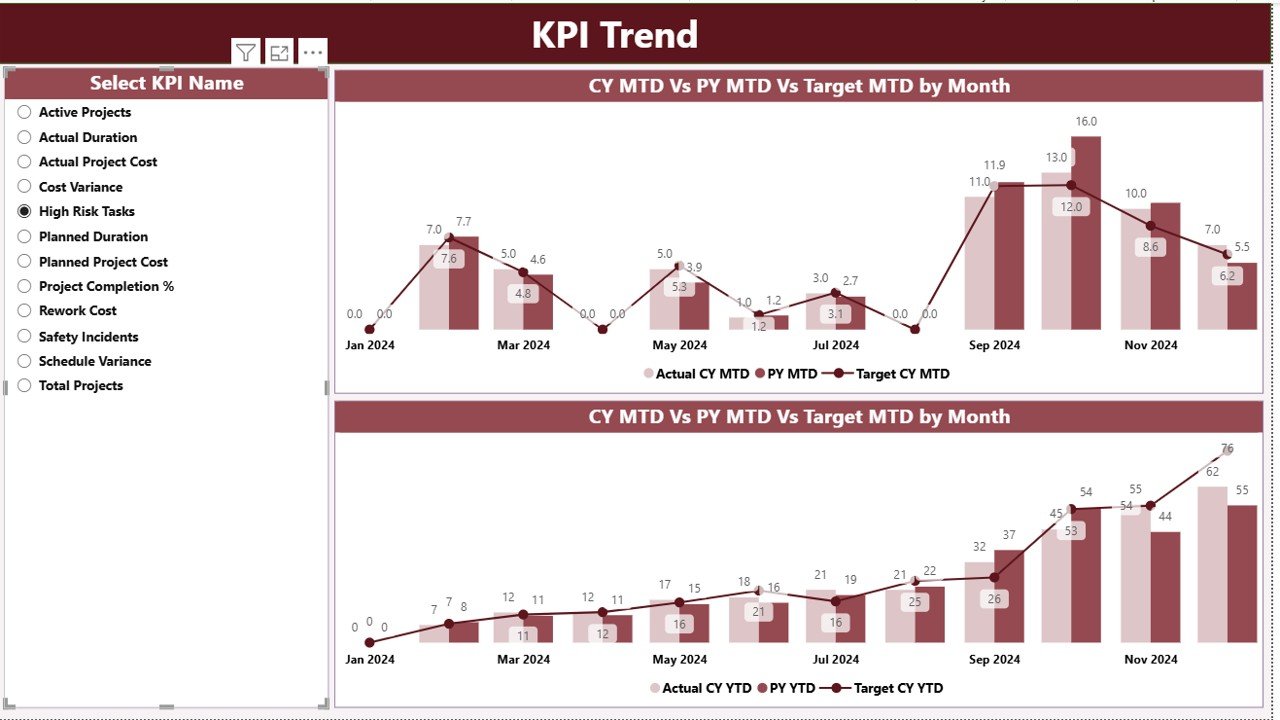
📈 2. KPI Trend Page – Performance Over Time
This page focuses on trend analysis and performance movement.
✔ Interactive combo charts
✔ Current Year vs Previous Year comparison
✔ Target vs Actual visualization
✔ Separate MTD and YTD trend views
✔ KPI selection slicer for deep analysis
It helps management understand performance behavior and identify improvement areas.
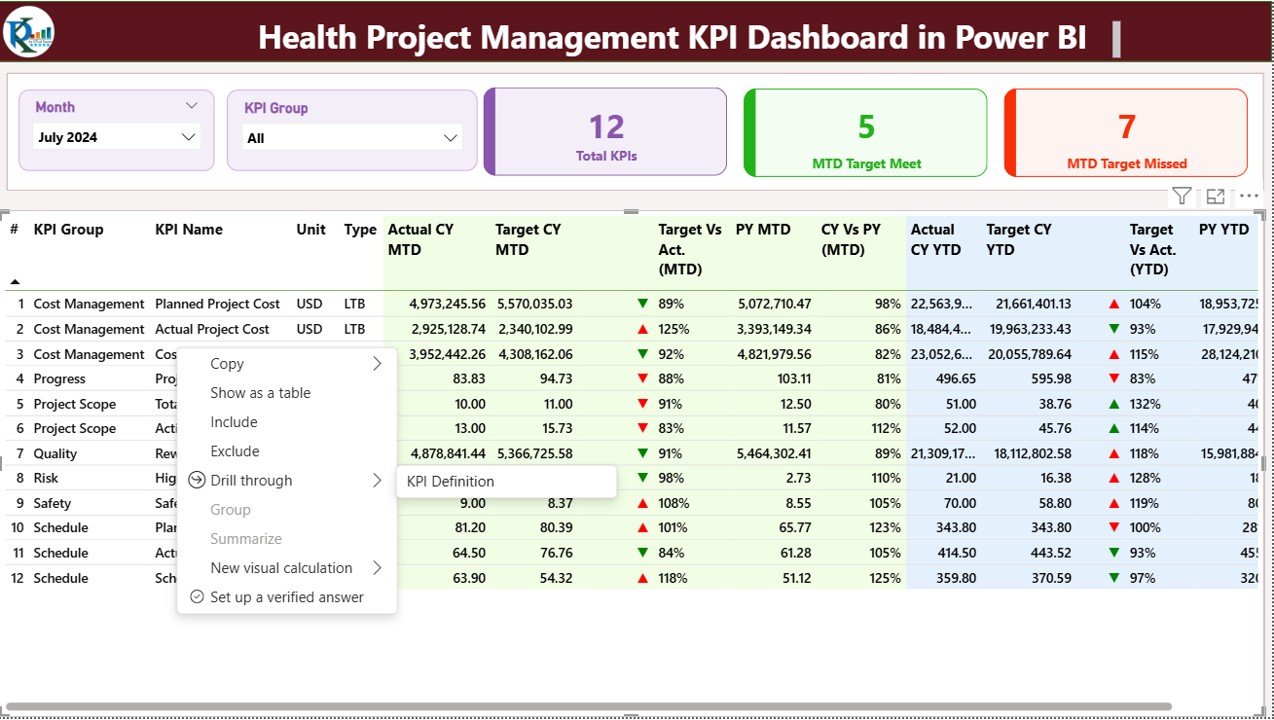
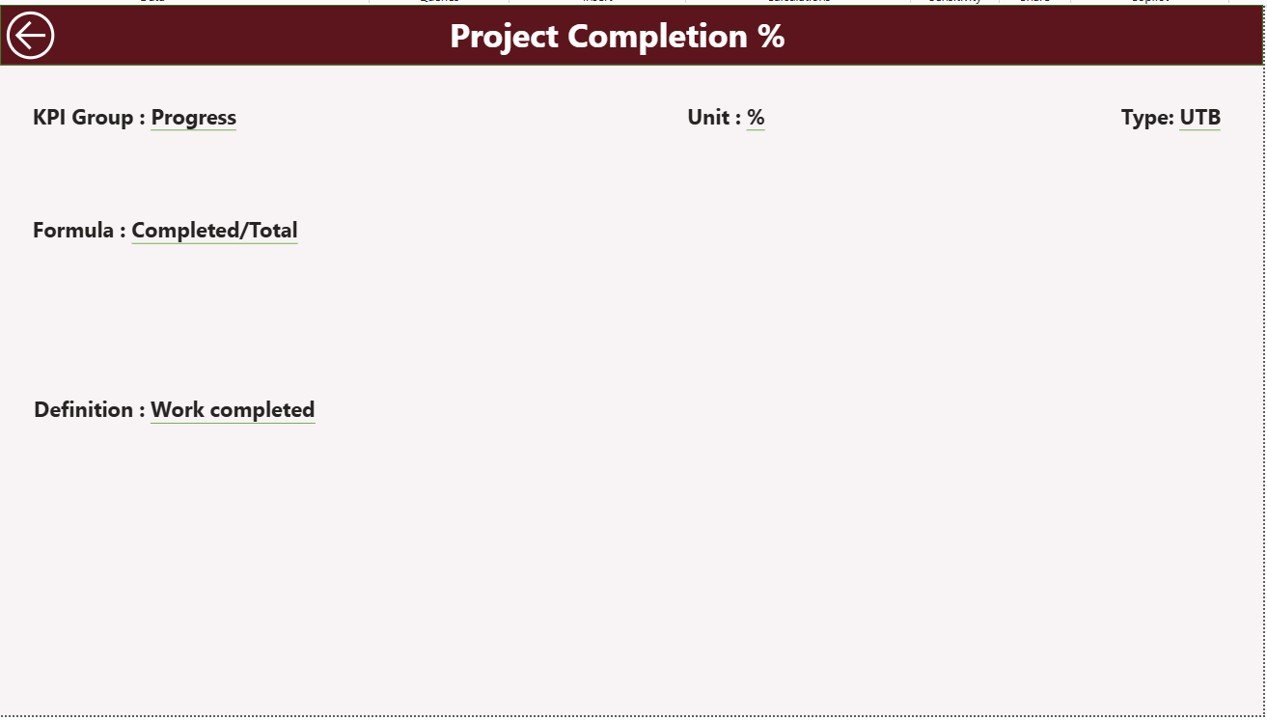
📘 3. KPI Definition Page – Reference & Clarity
This page acts as a KPI knowledge base.
✔ KPI Name
✔ KPI Group
✔ Formula
✔ Definition
✔ KPI Type (LTB / UTB)
🔹 Accessible through drill-through
🔹 Includes a back button for smooth navigation
🧩 How to Use the Health Project Management KPI Dashboard
1️⃣ Enter actual values in the Input_Actual Excel sheet
2️⃣ Update targets in the Input_Target sheet
3️⃣ Maintain KPI structure in the KPI Definition sheet
4️⃣ Refresh Power BI
5️⃣ Analyze KPIs instantly with visuals and indicators
No coding or advanced Power BI knowledge required.
👥 Who Can Benefit from This Dashboard?
✔ Healthcare Project Managers
✔ Hospital Administrators
✔ PMO Teams
✔ Healthcare Consultants
✔ Operations Managers
✔ Strategy & Planning Teams
✔ Healthcare Analysts
This dashboard is ideal for anyone responsible for tracking healthcare project performance.
🚀 Why Choose This Dashboard?
✅ Saves reporting time
✅ Improves project visibility
✅ Enhances accountability
✅ Supports data-driven decisions
✅ Scalable for multiple projects
✅ Professional and presentation-ready
With this dashboard, you gain control, clarity, and confidence in managing healthcare projects.
Click here to read the Detailed Blog Post
Watch the step-by-step video tutorial:


Reviews
There are no reviews yet.