Sustainability, renewable energy adoption, and carbon reduction are no longer optional for modern organizations. Governments, investors, customers, and regulators increasingly expect businesses to measure, monitor, and report their green energy performance clearly. However, many teams still track renewable energy usage and emissions data in scattered spreadsheets and manual reports. As a result, insights remain unclear, progress is hard to measure, and sustainability goals stay unfulfilled.
That is exactly why the Green Energy Adoption KPI Dashboard in Google Sheets becomes a powerful and practical solution.
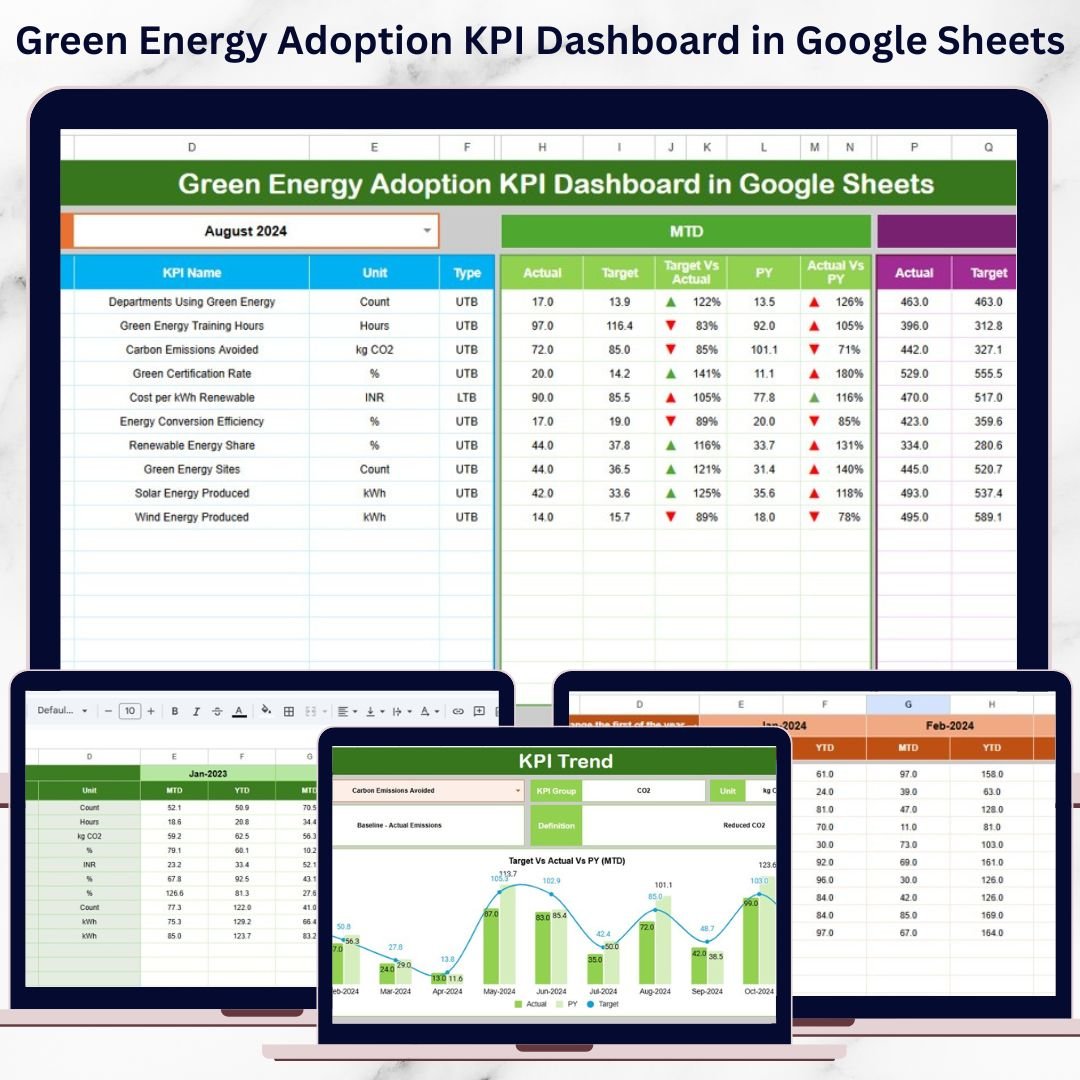
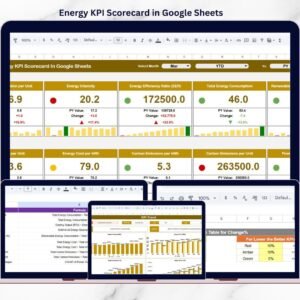
This ready-to-use dashboard helps organizations track renewable energy usage, carbon reduction, energy efficiency, and sustainability targets in one centralized and visual system. Instead of manually compiling sustainability reports, teams gain instant visibility into Month-to-Date (MTD) and Year-to-Date (YTD) performance, target achievement, and year-over-year improvement. With automated calculations, trend analysis, and clear performance indicators, the dashboard transforms raw energy data into actionable insights.
Because the dashboard is built entirely in Google Sheets, it remains cloud-based, collaborative, easy to use, and cost-effective—without requiring expensive sustainability or energy management software.
✨ Key Features of the Green Energy Adoption KPI Dashboard in Google Sheets
🌱 Centralized Green Energy KPI Monitoring
Track all renewable energy, emissions, and efficiency KPIs in one structured dashboard instead of multiple files.
🎯 MTD & YTD Performance Tracking
Monitor short-term and long-term green energy adoption progress automatically.
📊 Target vs Actual & Previous Year Comparison
Compare actual performance against sustainability targets and previous-year benchmarks.
🚦 Visual Performance Indicators
Conditional formatting arrows make performance interpretation instant:
-
Green arrow → improvement
-
Red arrow → decline
☁️ Google Sheets-Based Collaboration
Energy, sustainability, and ESG teams can work together in real time from anywhere.
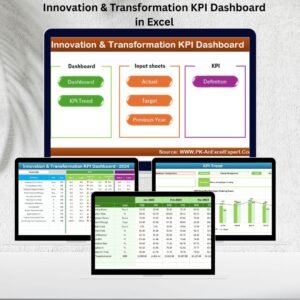
📦 What’s Inside the Green Energy Adoption KPI Dashboard in Google Sheets
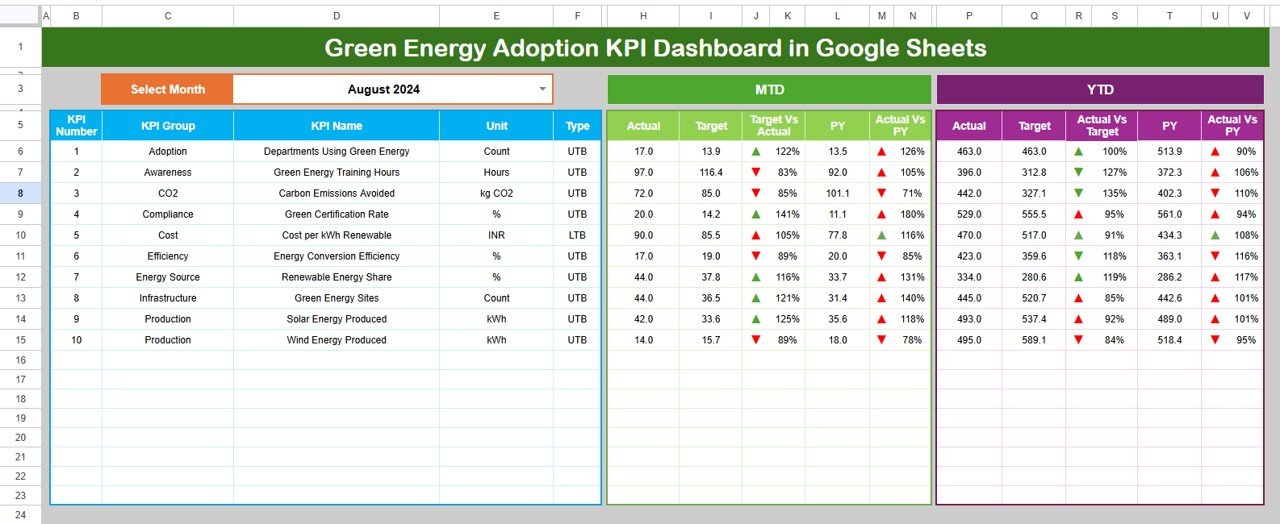
🖥️ Dashboard Sheet Tab (Main Page)
This is the primary reporting view for leadership and sustainability reviews.
You select the reporting month from the dropdown in cell D3, and the entire dashboard updates automatically.
It displays:
MTD Metrics
-
Actual
-
Target
-
Previous Year
-
Target vs Actual
-
Previous Year vs Actual
YTD Metrics
-
Actual
-
Target
-
Previous Year
-
Target vs Actual
-
Previous Year vs Actual
This layout gives decision-makers instant clarity on sustainability progress.
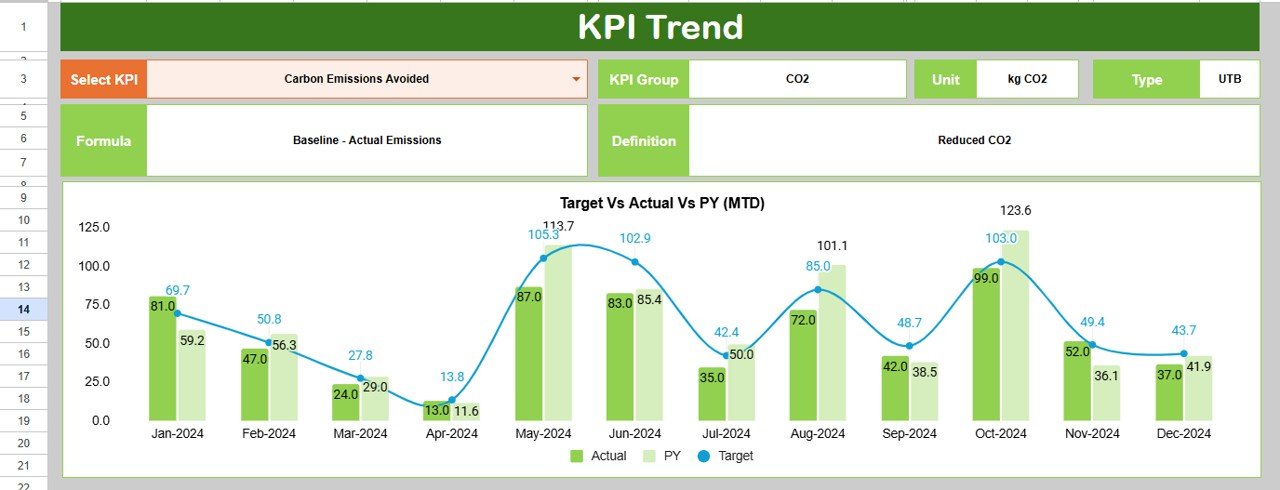
📉 KPI Trend Sheet Tab
This sheet focuses on individual KPI analysis.
Select a KPI from the dropdown in cell C3, and the sheet displays:
-
KPI Group
-
KPI Unit
-
KPI Type (Lower the Better / Upper the Better)
-
KPI Formula
-
KPI Definition
Month-wise trend charts help identify seasonal patterns, improvement pace, and inefficiencies.
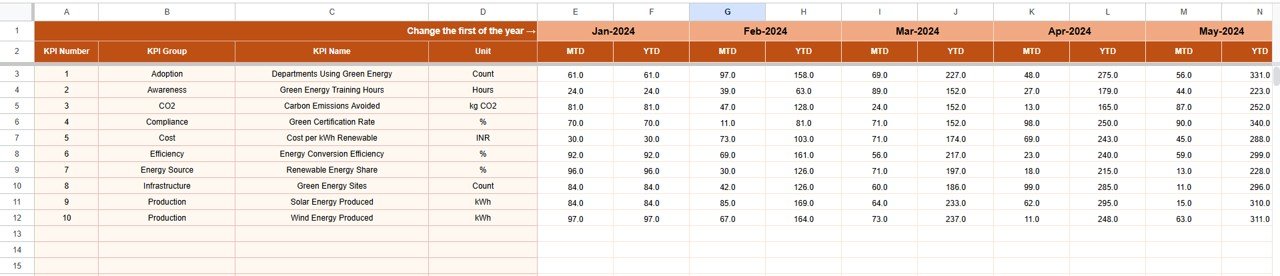
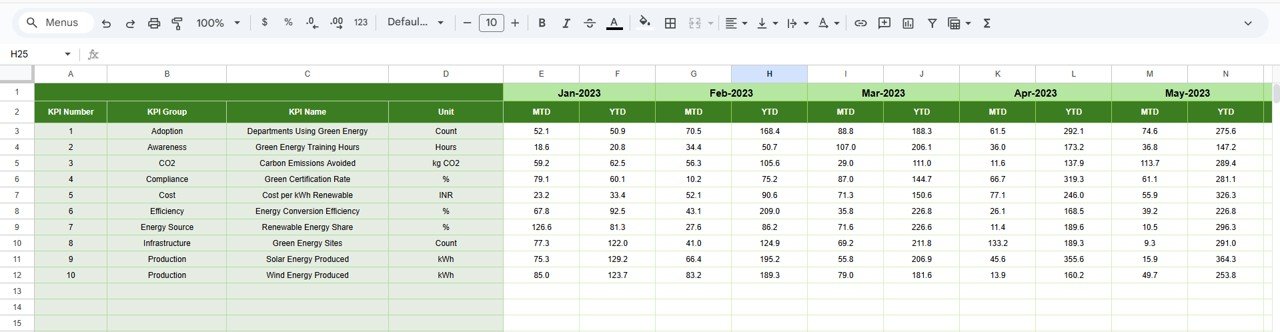
📋 Actual Number Sheet Tab
This sheet stores actual performance data.
-
Enter the first month of the year in cell E1
-
Input monthly MTD and YTD actual values
-
Dashboard updates automatically
This ensures accurate and consistent data tracking.
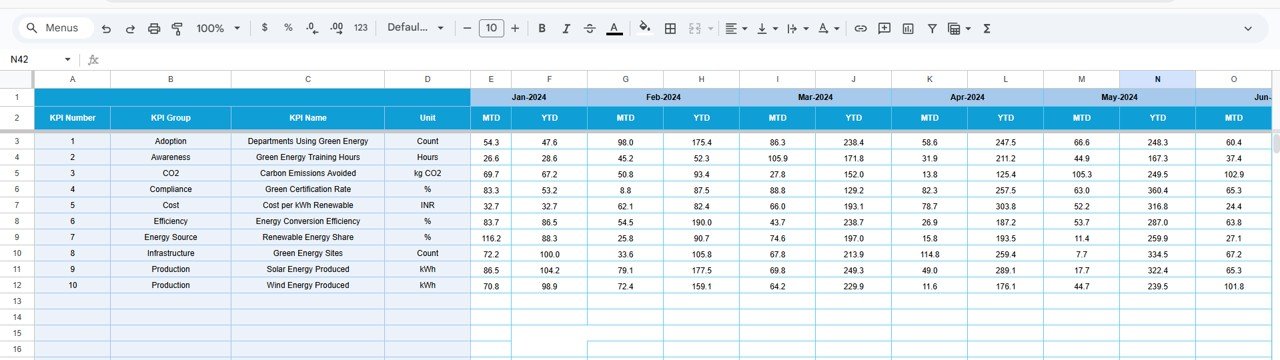
🎯 Target Sheet Tab
This sheet stores sustainability targets.
-
Monthly (MTD) targets
-
Annual (YTD) targets
Targets help organizations track ESG commitments and green energy goals.
📆 Previous Year Number Sheet Tab
This sheet stores last year’s energy and sustainability data.
It supports:
-
Year-over-year comparison
-
Long-term improvement tracking
-
ESG and audit reporting
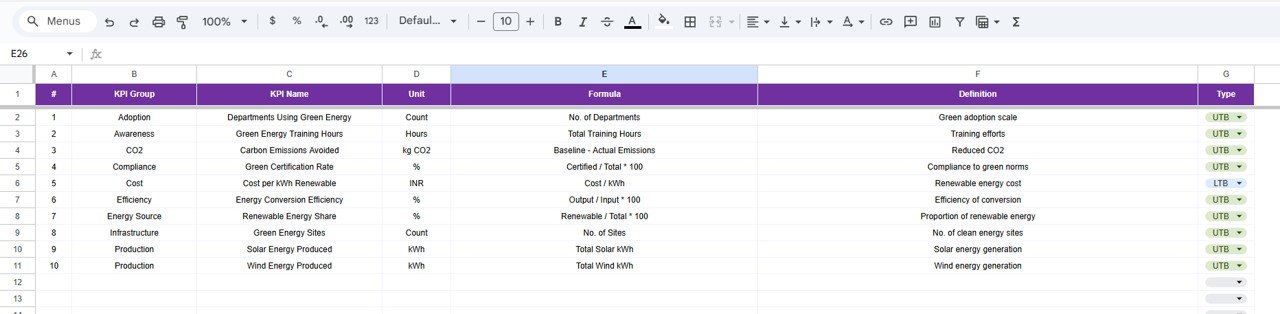
📘 KPI Definition Sheet Tab
This is the foundation of the dashboard. It includes:
-
KPI Name
-
KPI Group
-
Unit
-
Formula
-
KPI Definition
-
KPI Type (LTB / UTB)
It ensures clarity, transparency, and consistency across teams.
🎯 Who Can Benefit from This Green Energy Adoption KPI Dashboard
🌍 Sustainability & ESG Teams
Track renewable energy adoption and emissions reduction clearly.
⚡ Energy & Facilities Managers
Monitor energy efficiency and identify optimization opportunities.
🏭 Manufacturing & Utilities
Measure clean energy transition progress across operations.
📊 Management & Leadership
Review sustainability performance without complex BI tools.
🚀 Organizations of Any Size
Adopt a scalable, cost-effective green energy reporting solution.
### Click here to read the Detailed blog post
Watch the step-by-step video tutorial:


Reviews
There are no reviews yet.