


The Graphic Design Dashboard in Power BI is a stunning blend of creativity and analytics — built to help design agencies, marketing teams, and freelancers track, manage, and optimize their creative workflows.
In the fast-paced design world, success isn’t just about aesthetics — it’s about measurable performance. This ready-to-use Power BI dashboard turns scattered project data into clear, interactive visuals that showcase everything from client satisfaction to design costs, team efficiency, and platform performance.
Whether you manage multiple designers or freelance clients, this dashboard helps you make smarter, faster, and more creative decisions — powered by real-time analytics.
✨ Key Features of the Graphic Design Dashboard in Power BI
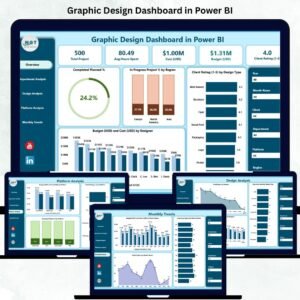
✅ 📊 Overview Page – The Performance Hub
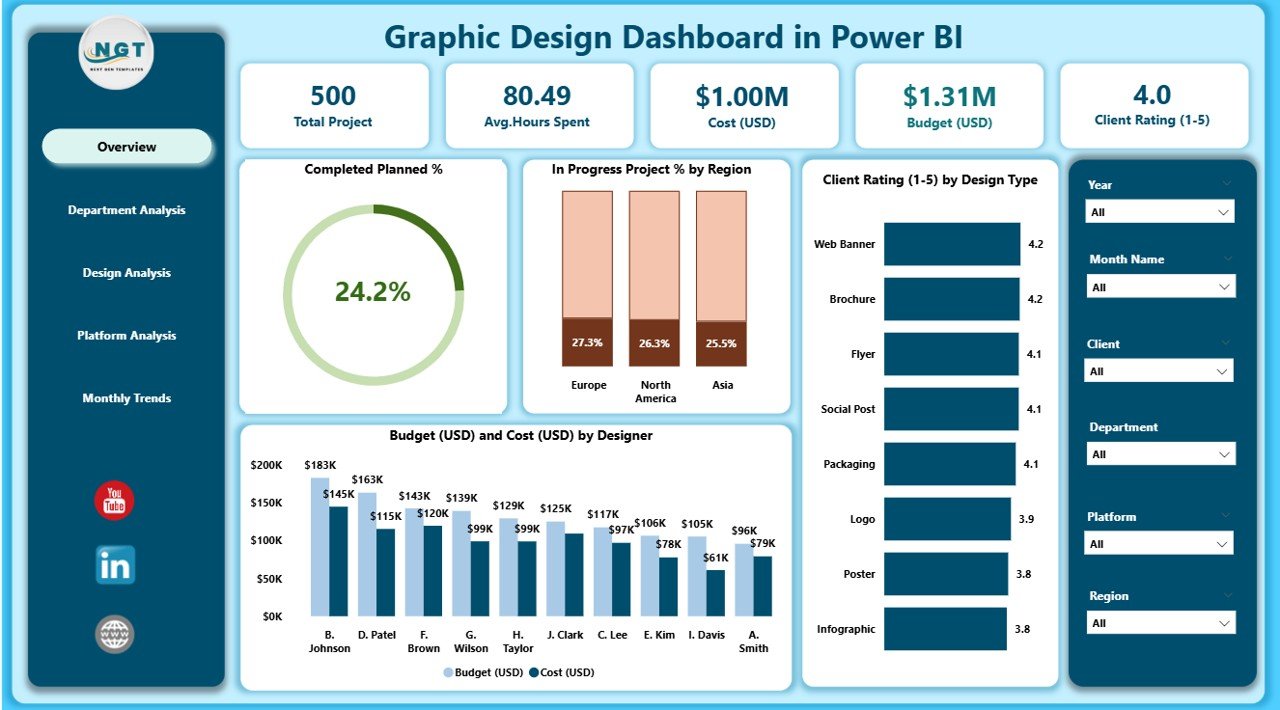
Get a high-level snapshot of your design performance across projects, designers, and clients.
Includes:
-
5 KPI Cards: Completed Planned %, In-Progress Projects %, Client Rating (1–5), Budget (USD), and Cost (USD).
-
4 Charts: Completed Planned % by Region, In-Progress Project % by Region, Client Rating by Design Type, and Budget vs Cost by Designer.
🎯 Quickly assess project health, track regional performance, and monitor client satisfaction — all in one view.
✅ 🏢 Department Analysis Page – Evaluate Team Efficiency
Analyze how each department contributes to performance and profitability.
Charts include:
-
Completed Planned % by Department
-
Budget (USD) vs Cost (USD) by Department
-
Average Hours Spent by Department
💡 Compare workloads, budgets, and output to optimize resource allocation across teams.
✅ 🎨 Design Analysis Page – Deep Dive into Creativity
Understand which designers and design types drive the best outcomes.
Visuals include:
-
Total Projects by Designer
-
Average Hours Spent by Design Type
-
Budget (USD) and Cost (USD) by Designer
🧠 Ideal for performance reviews, productivity tracking, and identifying design efficiency patterns.
✅ 🌐 Platform Analysis Page – Track Platform Impact
Measure how well designs perform across platforms like web, print, social media, or mobile.
Charts display:
-
Budget and Cost by Platform
-
Completed Planned % by Platform
-
Client Rating (1–5) by Platform
🚀 Discover which platforms generate the highest ROI and satisfaction to refine creative strategies.
✅ 📅 Monthly Trends Page – Monitor Growth Over Time
Track progress and performance monthly with dynamic trend visuals.
Includes:
-
Budget vs Cost by Month
-
Total Projects by Month
-
Average Hours Spent by Month
📈 Spot seasonal design demand, track workload cycles, and plan budgets accurately.
📦 What’s Inside the Graphic Design Dashboard
📁 Five Interactive Pages:
1️⃣ Overview Page – Quick visual summary of all KPIs.
2️⃣ Department Analysis – Team and cost efficiency review.
3️⃣ Design Analysis – Designer-level performance insights.
4️⃣ Platform Analysis – Compare ROI across platforms.
5️⃣ Monthly Trends – Time-based growth tracking.
🎯 Key KPIs Covered:
-
Completed Planned %
-
In-Progress Projects %
-
Client Rating (1–5)
-
Budget vs Cost (USD)
-
Average Hours Spent
💡 All metrics are visualized using color-coded charts, cards, and slicers for clarity and impact.
⚙️ How to Use the Dashboard
1️⃣ Connect Your Data Source: Link your Excel or database files.
2️⃣ Refresh Regularly: Keep data updated for real-time accuracy.
3️⃣ Filter & Explore: Use slicers to view performance by region, designer, or platform.
4️⃣ Analyze Trends: Compare current vs previous months to spot improvement areas.
5️⃣ Share Insights: Publish reports or share visuals with clients and teams securely.
💡 Pro Tip: Use conditional formatting arrows and icons for instant performance cues.
👥 Who Can Benefit from This Dashboard
🎨 Creative Agencies – Monitor project loads, profitability, and client satisfaction.
🧑💼 Design Managers – Evaluate team performance and optimize resource allocation.
💻 Freelancers – Track projects, hours, and client ratings easily.
📈 Marketing Teams – Measure visual impact across multiple campaigns.
💰 Finance & Operations – Compare actual vs budgeted design costs.
🏢 Corporate Studios – Align design efforts with business goals.
With this dashboard, creativity meets clarity — empowering every design decision with real-time intelligence.
🔗 Click here to read the Detailed Blog Post
🎥 Visit our YouTube channel to learn step-by-step video tutorials


Reviews
There are no reviews yet.