


In today’s fast-paced public sector, efficiency, transparency, and accountability are no longer optional — they’re essential. The Government Administration Dashboard in Excel is a powerful, ready-to-use template designed to simplify how government departments track performance, manage budgets, and measure citizen satisfaction.
Built entirely in Microsoft Excel, this interactive dashboard provides a single view of your projects, budgets, and KPIs — helping administrators make data-driven decisions faster and with greater confidence. Whether you manage a city council, a state department, or a national ministry, this tool delivers instant insights into performance, resource allocation, and service outcomes.Government Administration Dashboard in Excel
✨ Key Features of the Government Administration Dashboard in Excel
-
🧾 Comprehensive Performance Tracking: Monitor project progress, budgets, and citizen satisfaction across multiple departments in real time.
-
📊 Interactive Visuals: Dynamic charts, pivot tables, and slicers let you drill down by region, department, or time period effortlessly.
-
🏗️ Multi-Sheet Structure: Includes Overview, Department Analysis, Region Analysis, Project Analysis, and Monthly Trends sheets for complete visibility.
-
🎯 KPI-Driven Insights: Instantly identify top-performing departments and underperforming areas through automated KPI calculations.
-
🧮 Built-in Excel Automation: Leverages Excel formulas and pivot logic — no coding or advanced setup required.
-
📈 Budget Control: Compare allocated vs. actual spending with clear variance visuals.
-
😊 Citizen-Centric View: Track satisfaction scores and beneficiary counts to ensure community-focused outcomes.
-
🔒 Data Security: Utilize Excel’s password protection and access control features to secure sensitive information.

📦 What’s Inside the Government Administration Dashboard
When you download this dashboard, you’ll get a fully formatted Excel file with dedicated analytical sheets designed for clarity and usability:
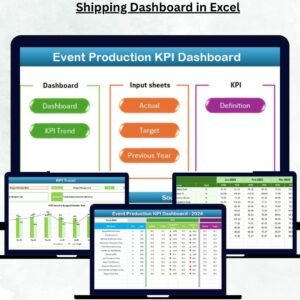
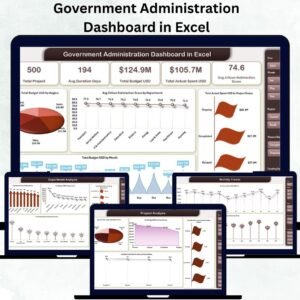
1️⃣ Overview Sheet:
A high-level snapshot showing total projects, average duration, total and actual budgets, and citizen satisfaction scores — all visualized with colorful charts.Government Administration Dashboard in Excel
2️⃣ Department Analysis Sheet:
Deep-dive into departmental performance, comparing budgets, spending, and beneficiaries to identify efficiency gaps.
3️⃣ Region Analysis Sheet:
Assess regional equity with charts displaying project status, satisfaction scores, and funding utilization per region.
4️⃣ Project Analysis Sheet:
Evaluate individual project metrics — duration, spending, beneficiaries, and outcomes — to ensure each initiative stays on target.Government Administration Dashboard in Excel
5️⃣ Monthly Trends Sheet:
Observe fiscal and operational trends month-by-month to forecast expenditures and measure growth patterns.
Each page is interactive and powered by Excel slicers, giving you full control to explore the data as per your administrative priorities.
🧭 How to Use the Government Administration Dashboard
Using this dashboard is incredibly simple — even if you’re not an Excel expert:
-
📤 Enter Your Data: Replace sample data with your department’s actual figures.
-
🔍 Use Dropdown Filters: Filter insights by department, region, or month.
-
📊 View KPIs Instantly: Compare actual vs. target for MTD (Month-to-Date) and YTD (Year-to-Date) performance.
-
🧾 Analyze Trends: Study expenditure and satisfaction trends for better planning.
-
⚙️ Customize Easily: Add new KPIs, change chart titles, or modify visuals to match your organization’s branding.
-
💾 Protect Your Sheet: Secure the dashboard using Excel’s protection tools to prevent unwanted edits.
👥 Who Can Benefit from This Dashboard
This Excel template is designed for everyone involved in government performance and policy management:
-
🏢 Government Departments: Track projects, budgets, and operational metrics efficiently.
-
🌐 Public Sector Enterprises: Evaluate program success and ensure compliance.
-
🏛️ Municipal Administrators: Measure citizen satisfaction and local development outcomes.
-
📈 Policy Analysts & Auditors: Access real-time insights for transparent reporting.
-
🤝 NGOs & Agencies: Use the same structure to track funding utilization and project impact.
Whether for internal reporting or public communication, this dashboard transforms complex administrative data into actionable intelligence.
🔗 Click here to read the Detailed blog post
Watch the step-by-step video tutorial:


Reviews
There are no reviews yet.