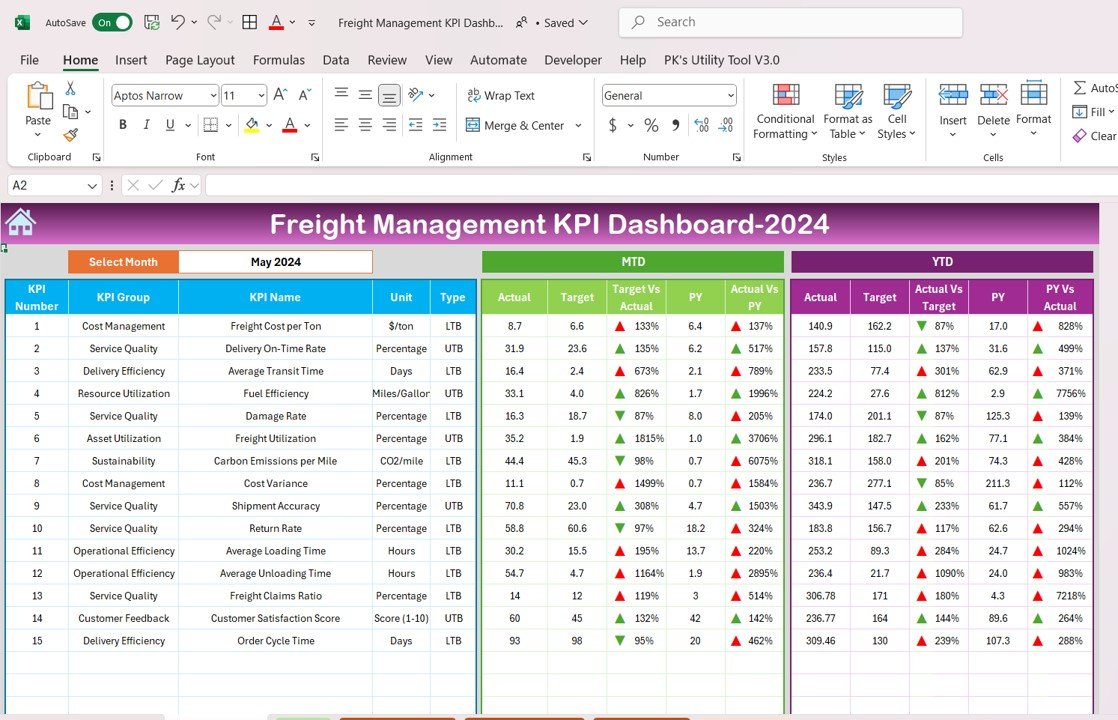
The Freight Management KPI Dashboard in Excel is a comprehensive tool designed for businesses involved in logistics, transportation, and freight management. This customizable dashboard helps you monitor, track, and analyze key performance indicators (KPIs) related to freight operations, including delivery performance, transportation costs, on-time delivery rates, and resource utilization.
With real-time data tracking, this Excel-based dashboard provides valuable insights into your freight management operations, allowing you to streamline processes, optimize costs, and improve overall service delivery. Whether you’re managing a fleet, overseeing freight operations, or optimizing shipping costs, the Freight Management KPI Dashboard in Excel is an essential tool for businesses aiming to improve efficiency and reduce costs in their freight operations.
Key Features of the Freight Management KPI Dashboard in Excel
🚚 Comprehensive Freight Tracking
Track key metrics such as total shipments, on-time delivery rates, transportation costs, and delivery performance. Monitor the overall efficiency of your freight operations to ensure timely deliveries and cost-effectiveness.
⚡ Real-Time Delivery Performance Monitoring
Monitor the performance of your freight operations in real-time. Track on-time deliveries, delays, and identify bottlenecks or inefficiencies that may be impacting delivery timelines.
📈 Cost Optimization & Resource Utilization
Analyze freight costs, including shipping, fuel, and labor expenses. Optimize resource allocation and identify areas where cost-saving measures can be implemented to improve profitability.
📅 Shipment & Freight Resource Management
Track freight resources, including fleet utilization and driver performance. Ensure that your resources are being used efficiently to maximize throughput and minimize idle time.
🖥️ Interactive & User-Friendly Interface
The dashboard is designed with user-friendliness in mind, featuring interactive charts, filters, and slicers. Easily explore performance data, identify trends, and make data-driven decisions to optimize freight management.
Why You’ll Love the Freight Management KPI Dashboard in Excel

✅ Track Delivery Performance & Timeliness
Monitor on-time delivery rates and overall delivery performance. Ensure that your freight operations are meeting customer expectations and adhering to service level agreements (SLAs).
✅ Optimize Freight Costs & Resource Allocation
Track transportation costs and identify areas where you can reduce expenses, such as optimizing shipping routes or improving fuel efficiency.
✅ Improve Operational Efficiency
Analyze fleet performance, shipment volumes, and resource utilization to identify inefficiencies and improve overall freight operations.
✅ Enhance Shipment Visibility
Get real-time visibility into the status of shipments, delivery timelines, and any potential delays, ensuring that you can take corrective action as needed.
✅ Make Data-Driven Decisions
Leverage insights from the dashboard to make informed decisions about shipment planning, cost optimization, and resource allocation, leading to improved freight management and reduced operational costs.
What’s Inside the Freight Management KPI Dashboard Template?
- Delivery Performance Tracking: Monitor on-time deliveries, delays, and overall performance to ensure that your freight services meet expectations.
- Freight Cost Analysis: Track transportation costs, including shipping, fuel, and labor expenses, to optimize cost efficiency.
- Fleet & Resource Utilization: Monitor fleet usage, driver performance, and resource allocation to maximize throughput.
- Real-Time Performance Insights: Stay on top of real-time performance metrics to identify issues and optimize your freight operations.
- Customizable KPIs: Adjust the dashboard to track specific KPIs relevant to your freight operations, such as shipping routes or inventory levels.
- Interactive Reporting: Use dynamic charts and filters to dive deep into your freight data and make data-driven decisions.
How to Use the Freight Management KPI Dashboard in Excel
1️⃣ Download the Template: Instantly access your Freight Management KPI Dashboard in Excel.
2️⃣ Enter Freight Data: Input data related to deliveries, transportation costs, fleet utilization, and driver performance.
3️⃣ Track & Monitor KPIs: Use the dashboard to monitor key freight performance metrics in real-time.
4️⃣ Analyze & Optimize: Leverage insights to improve delivery timeliness, optimize costs, and enhance resource utilization.
Who Can Benefit from the Freight Management KPI Dashboard in Excel?
🔹 Logistics Managers & Freight Coordinators
🔹 Fleet Managers & Transportation Teams
🔹 Business Owners & Entrepreneurs in Freight & Logistics
🔹 Operations Managers in the Freight Industry
🔹 Data Analysts in Freight Management & Logistics
🔹 Anyone Involved in Freight & Shipping Operations
Track, analyze, and optimize your freight management operations with the Freight Management KPI Dashboard in Excel. Monitor delivery performance, transportation costs, fleet usage, and more to improve the efficiency and profitability of your freight operations.
Click here to read the Detailed blog post
Visit our YouTube channel to learn step-by-step video tutorials
Youtube.com/@PKAnExcelExpert

















Reviews
There are no reviews yet.