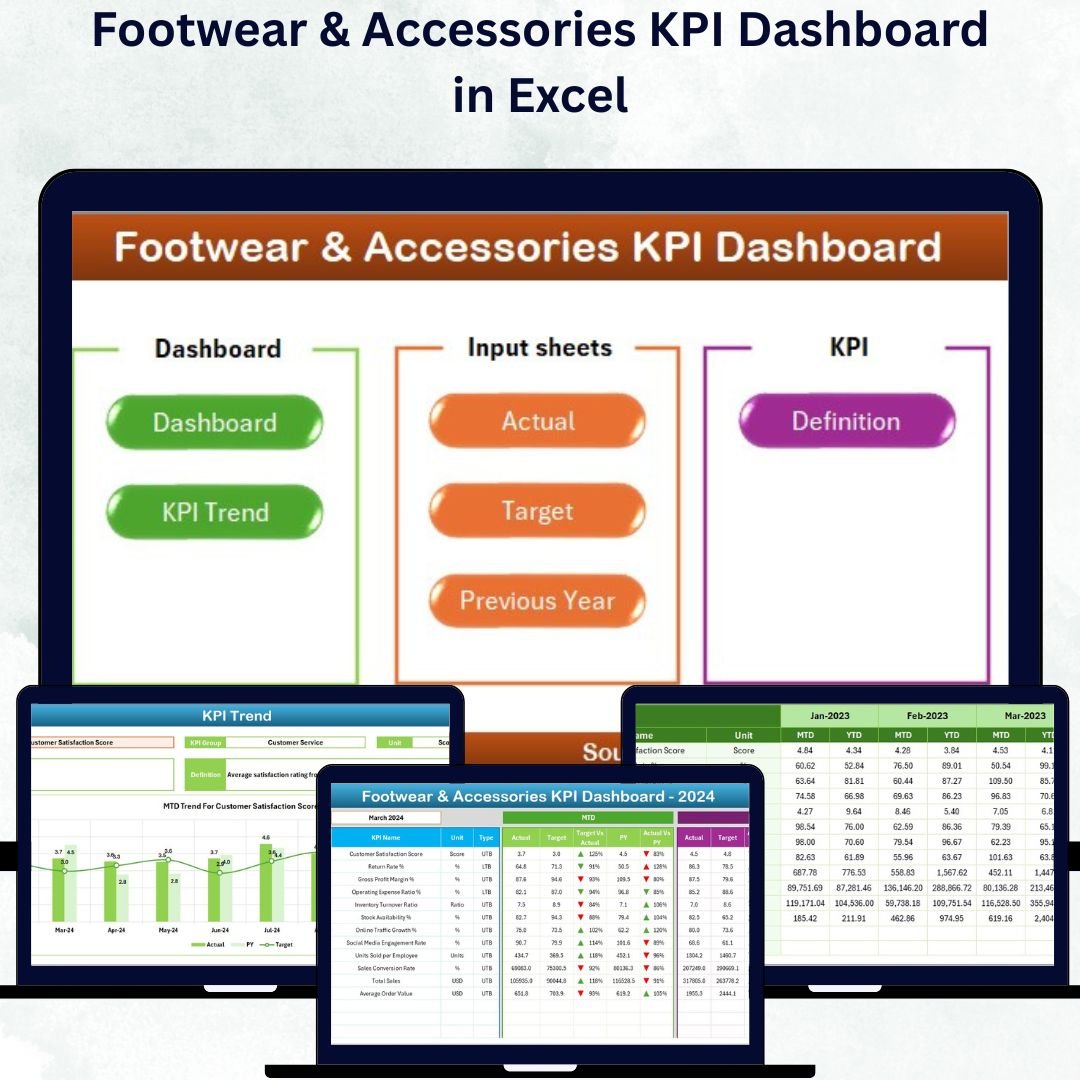
Footwear & Accessories KPI Dashboard in Excel in the ever-evolving retail world, data is the key to success — especially in the footwear and accessories industry, where inventory levels, customer preferences, and seasonal trends change rapidly 👠📊.
The Footwear & Accessories KPI Dashboard in Excel gives you a complete, ready-to-use solution to track performance, measure profitability, and improve decision-making — all in one interactive dashboard.
Footwear & Accessories KPI Dashboard in Excel with this dynamic Excel template, retailers, distributors, and e-commerce businesses can monitor sales, inventory, margins, and returns in real time, gaining actionable insights that drive growth and efficiency.
⚙️ Key Features of the Footwear & Accessories KPI Dashboard in Excel
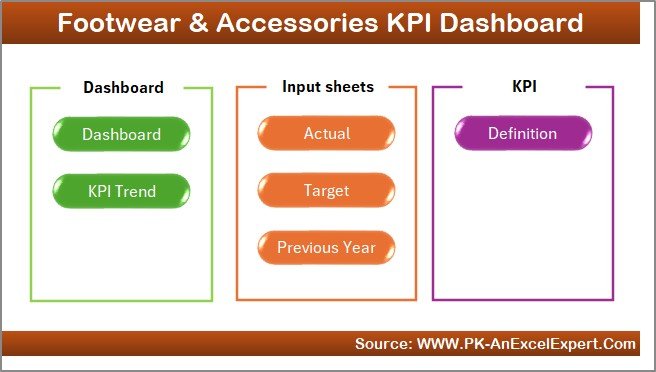
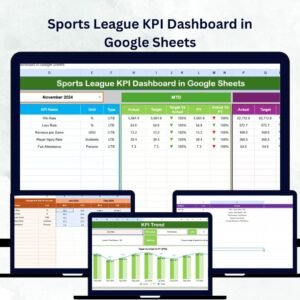
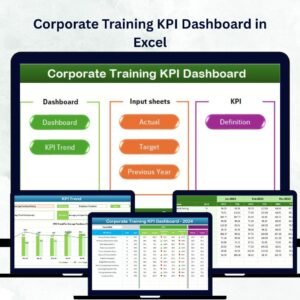
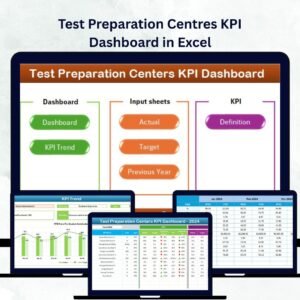
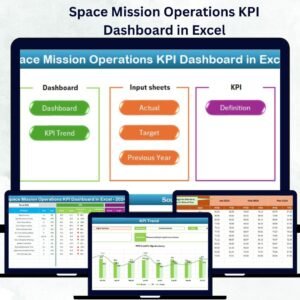
📊 7 Structured Worksheet Tabs – Home, Dashboard, KPI Trend, Actual Input, Target, Previous Year, and KPI Definition.
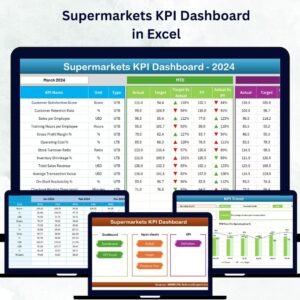
🎯 MTD & YTD Tracking – Compare performance for the month and year in one view.
🟢 Color Indicators (▲▼) – Instantly highlight performance improvement or decline.
📈 Dynamic Trend Charts – View historical performance trends by KPI.
💡 Dropdown Selections – Choose any month or KPI to auto-refresh data.
💰 Target vs Actual Analysis – Measure how close you are to hitting your goals.
📉 Previous Year Comparison – Track year-on-year growth or decline.
🧾 KPI Definition Sheet – Maintain clarity with formulas, definitions, and units.
⚙️ Fully Customizable – Add or modify KPIs as your business evolves.
💼 Professional Design – Clean, user-friendly, and ready for management reporting.
📦 What’s Inside the Template
1️⃣ Home Sheet – Central Navigation Hub
This intuitive menu includes six clickable buttons to navigate through the entire dashboard.
It acts as your command center, saving time and ensuring smooth workflow.
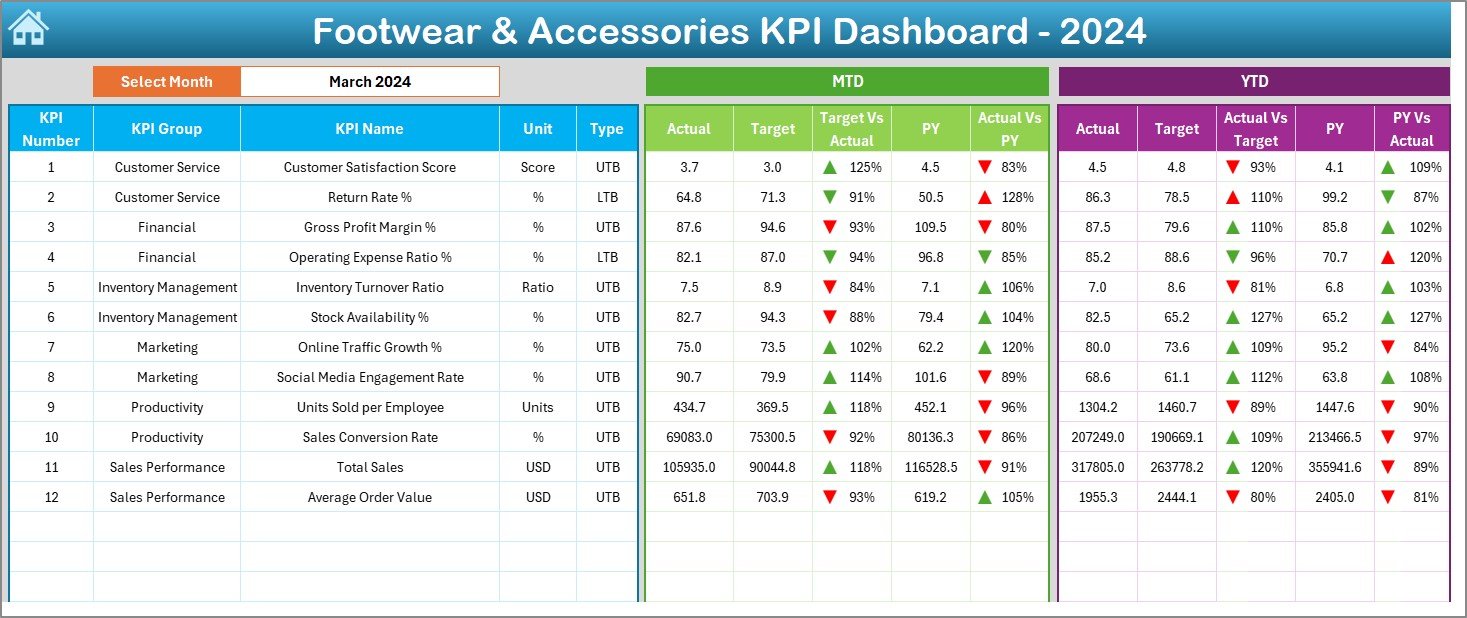
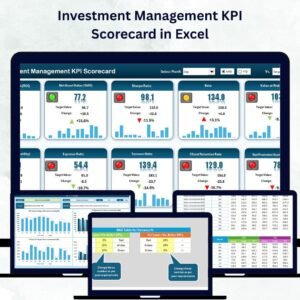
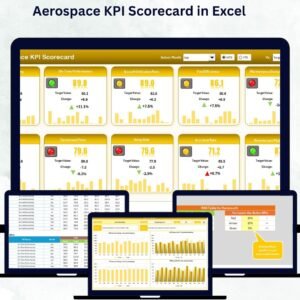
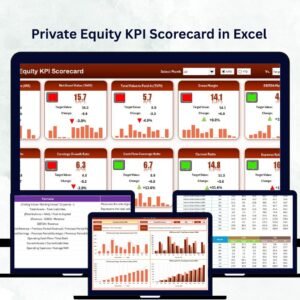
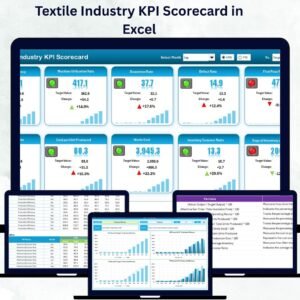
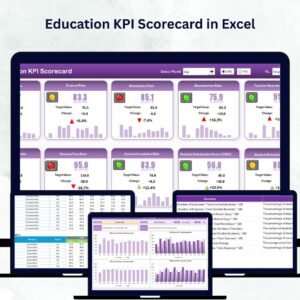
2️⃣ Dashboard Sheet – Performance Summary View
The Dashboard Sheet is where data comes alive 💡.
✨ Features Include:
-
Month Selector (Cell D3): Choose any month to refresh KPIs instantly.
-
MTD & YTD Performance: Automatically calculates and displays Actual, Target, and Previous Year numbers.
-
Visual Arrows & Colors: Highlight performance movement (up for growth, down for decline).
-
Comparative Analysis: Target vs Actual and Year-on-Year comparisons side by side.
This makes it easy for business owners and retail managers to identify what’s working — and where action is needed.
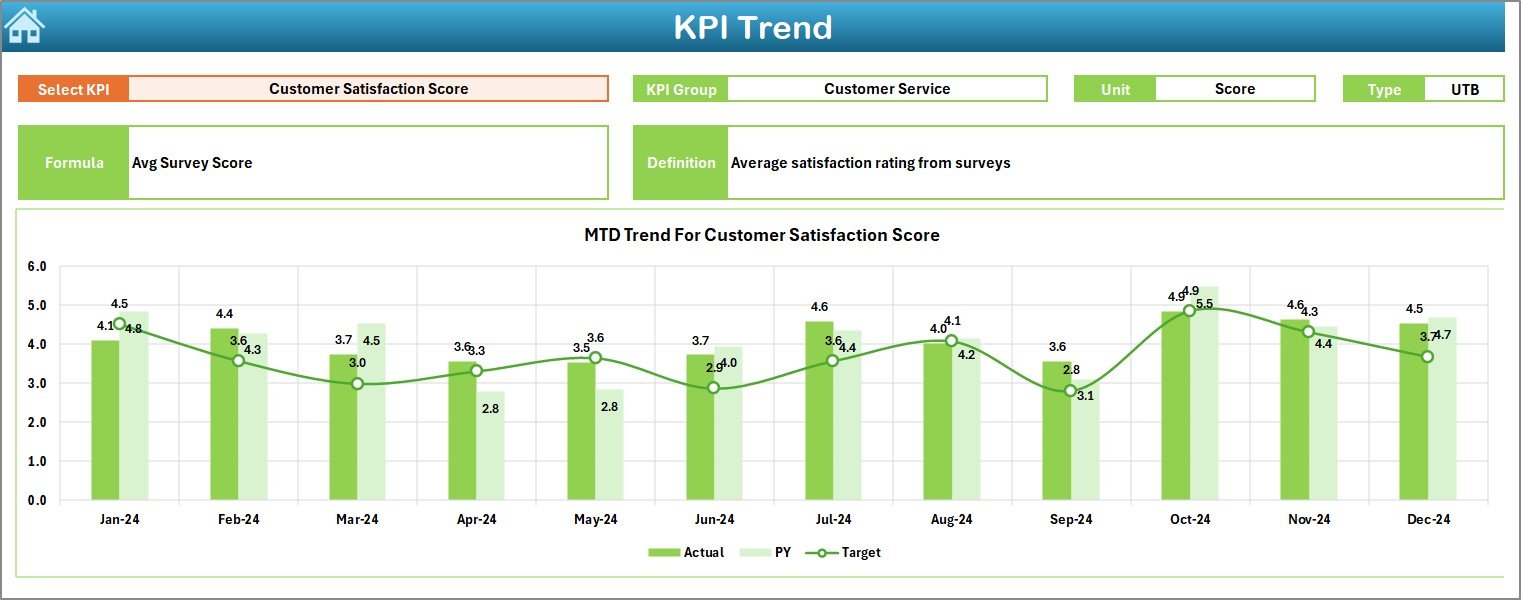
3️⃣ KPI Trend Sheet – Monitor Progress Over Time
The KPI Trend Sheet provides deep insights into long-term performance patterns.
📉 Key Highlights:
-
Dropdown (Cell C3): Select any KPI to view its performance trend.
-
Displayed Info: KPI Group, Unit, Formula, and Type (UTB/LTB).
-
Dynamic Charts: Show Actual, Target, and Previous Year data for MTD and YTD.
It’s ideal for spotting seasonal shifts, predicting demand, and optimizing stock planning.
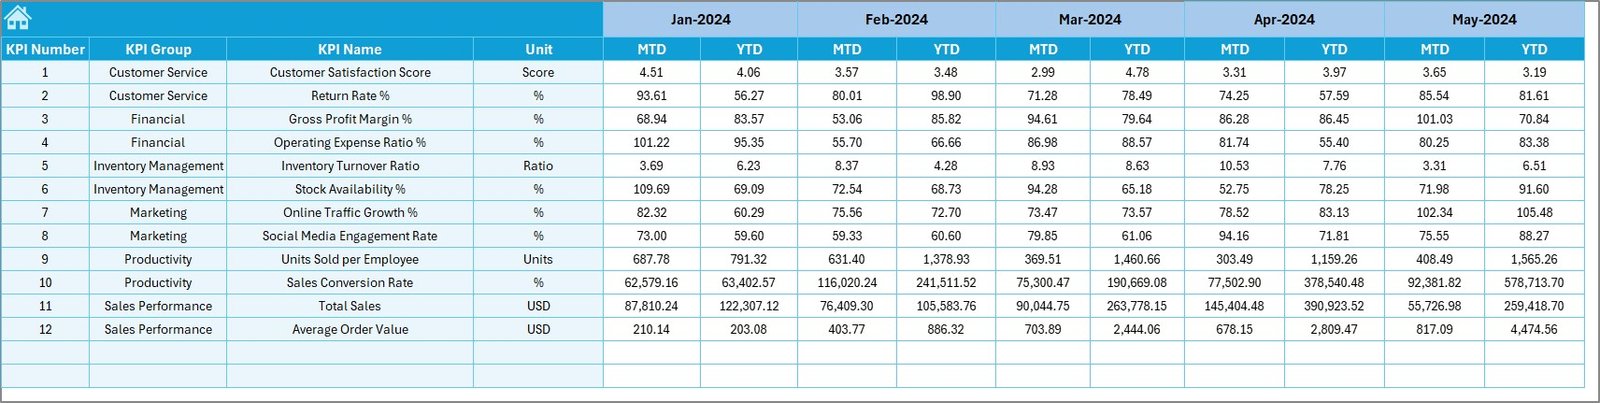
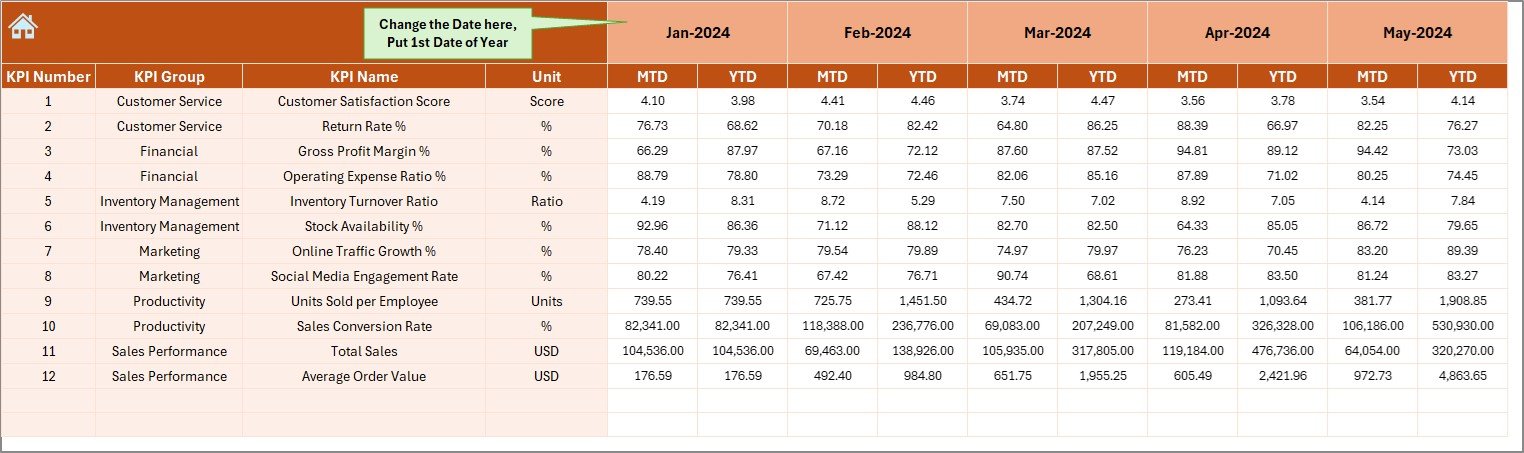
4️⃣ Actual Numbers Input Sheet – Data Engine
This is the foundation of your dashboard where actual business data is entered.
-
Enter MTD and YTD actual values for each KPI.
-
Define the first month of your fiscal year (Cell E1).
-
Automatically updates all linked sheets and charts in real time.
5️⃣ Target Sheet – Set Benchmarks for Success
Define your goals and measure progress with precision 🎯.
-
Input monthly (MTD) and yearly (YTD) target values.
-
The dashboard automatically compares targets with actuals.
-
Color-coded alerts make it easy to identify areas falling behind.
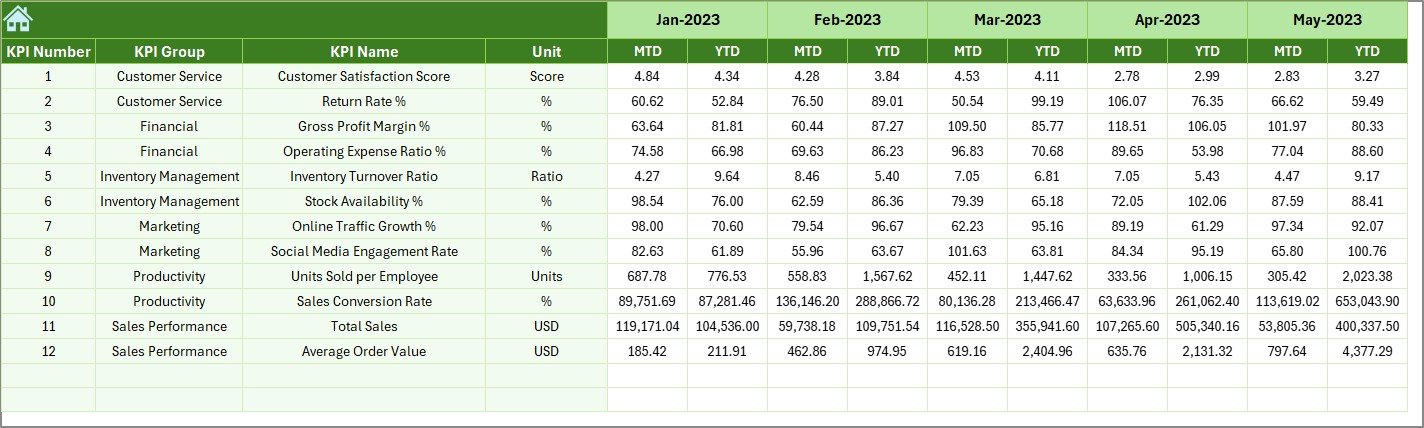
6️⃣ Previous Year Numbers Sheet – Benchmarking for Growth
Record previous year’s KPIs to measure progress and improvement trends.
This historical data provides essential context for setting realistic goals and analyzing growth.
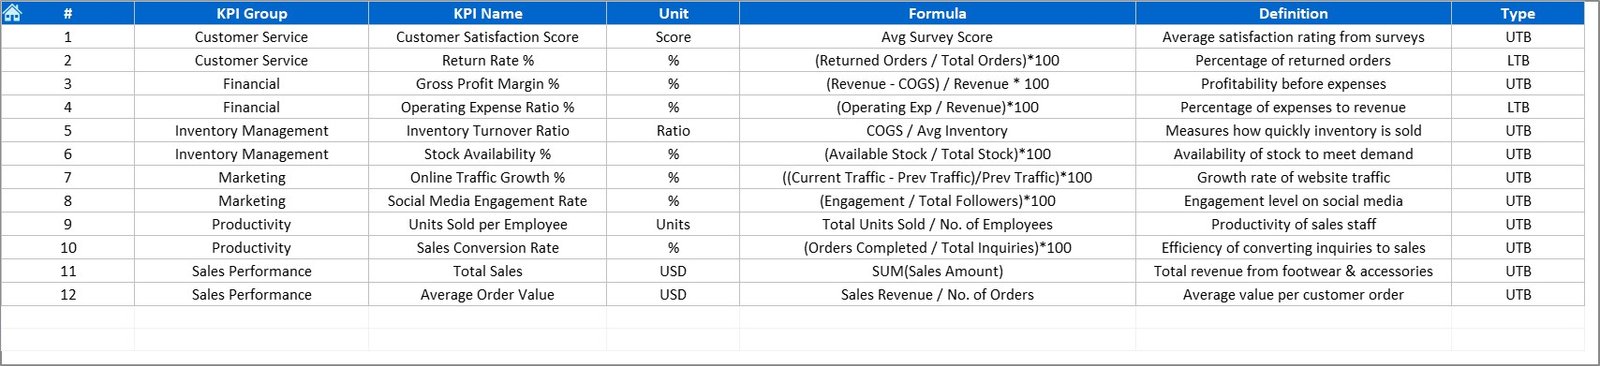
7️⃣ KPI Definition Sheet – Maintain Consistency
Ensure team-wide clarity with well-defined KPIs.
Includes columns for KPI Name, Group, Unit, Formula, and Definition — ensuring everyone interprets results the same way.
💡 Why Use This Dashboard
👟 All-in-One View: Manage sales, operations, and finance KPIs in one Excel file.
📊 Data-Driven Clarity: Eliminate guesswork with real-time visuals and metrics.
💼 Better Accountability: Assign KPIs to departments for transparent tracking.
⚙️ Automation Power: No manual calculations — Excel formulas do it all.
📈 Benchmark Progress: Measure against targets and previous years effortlessly.
This dashboard gives you a 360° view of performance across every retail dimension — from revenue to returns.
🌟 Advantages of the Footwear & Accessories KPI Dashboard in Excel
✅ Real-Time Updates: See your MTD and YTD results instantly.
✅ Visual Insights: Charts and color cues simplify performance tracking.
✅ Customizable: Add new KPIs or departments with ease.
✅ Affordable: No extra software costs — powered entirely by Excel.
✅ Time-Saving: Automated calculations and charts reduce manual work.
✅ Scalable: Perfect for both small boutiques and large retail chains.
🧭 How to Use the Dashboard Effectively
1️⃣ Customize KPIs in the Definition Sheet based on your business goals.
2️⃣ Enter monthly Actual, Target, and Previous Year data.
3️⃣ Select the month in Cell D3 on the Dashboard tab.
4️⃣ Review MTD/YTD visuals and trend charts.
5️⃣ Analyze insights and take corrective action where needed.
Within minutes, you’ll have a complete retail performance overview for smarter decision-making.
👥 Who Can Benefit from This Template
-
Footwear Retailers 👠
-
Fashion & Accessories Brands 👜
-
E-commerce Sellers 🛍️
-
Store Managers & Analysts 📈
-
Distributors & Merchandisers 📦
Whether you manage a single boutique or a nationwide chain, this tool gives you full control over your KPIs — improving performance and profitability across every level.
🧠 Conclusion
The Footwear & Accessories KPI Dashboard in Excel is a must-have performance management tool for the modern retailer.
It transforms complex sales, stock, and profit data into a visual, interactive, and actionable dashboard.
From identifying best-selling products to improving stock turnover, this dashboard empowers you to make data-driven decisions that enhance growth, efficiency, and customer satisfaction 🌟.
Start using it today and take your retail performance to the next level!


Reviews
There are no reviews yet.