Running a Food and Beverage Dashboard in Excel is no easy task. From controlling food costs and tracking sales revenue to managing production and availability, managers must constantly juggle multiple priorities. Without a structured reporting system, decisions often rely on guesswork instead of real data—leading to inefficiencies and missed opportunities.
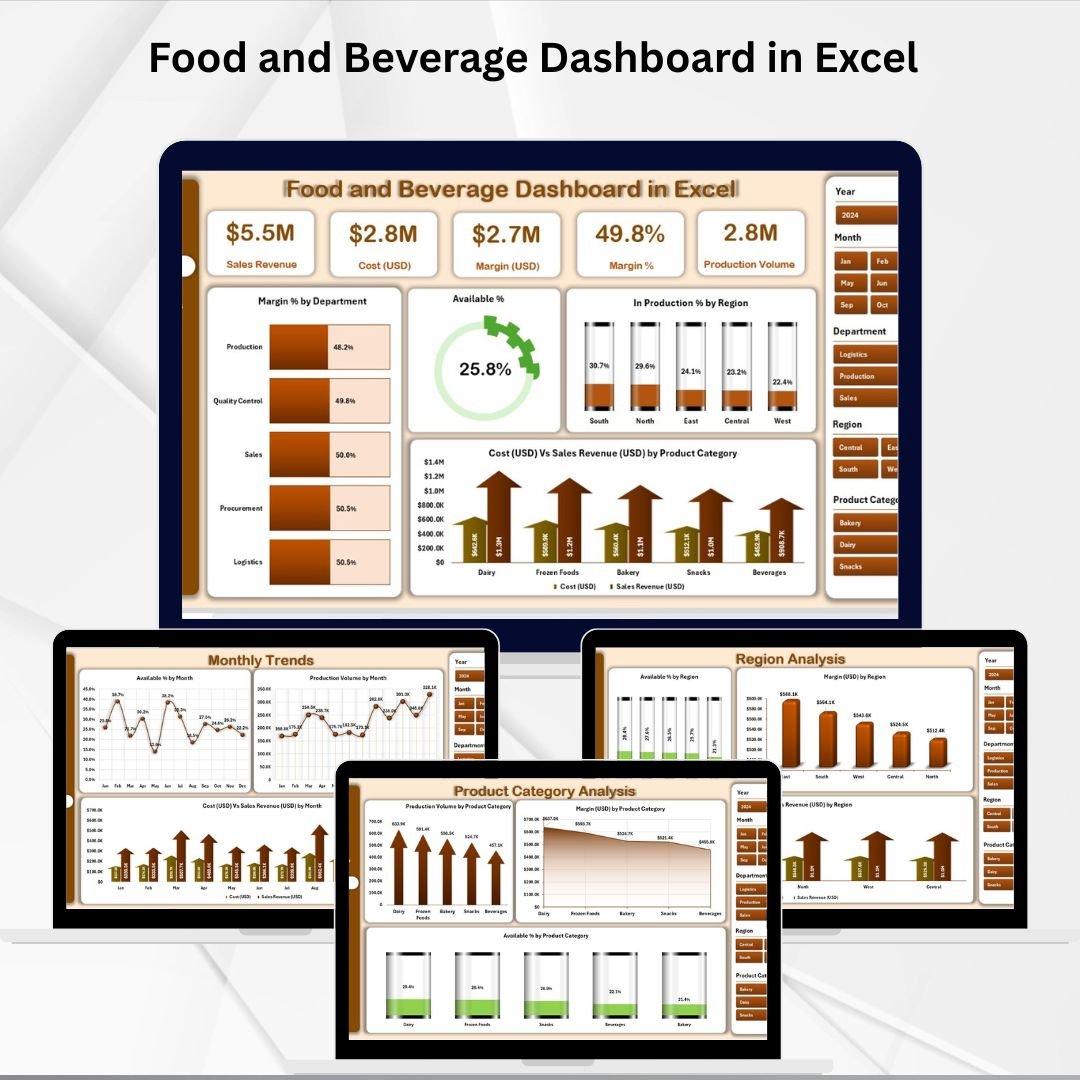
That’s why we created the Food and Beverage Dashboard in Excel. 🎯 This ready-to-use, interactive template transforms raw data into actionable insights, helping you track profitability, analyze performance, and make smarter business decisions—all in one place. Whether you manage a restaurant, café, hotel, or food manufacturing unit, this Excel dashboard is your ultimate reporting solution.
✨ Key Features of Food and Beverage Dashboard in Excel
-
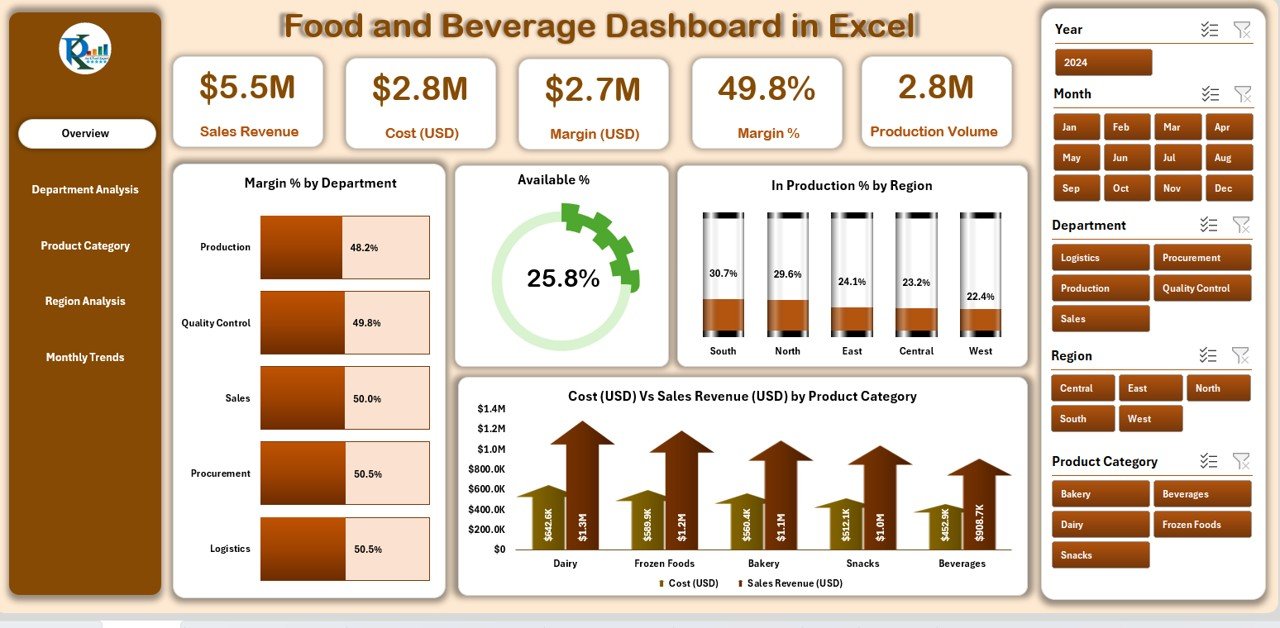
📊 Overview Page – Navigate with ease, filter data using slicers, and track key KPIs like margin %, availability %, and cost vs. revenue.
-
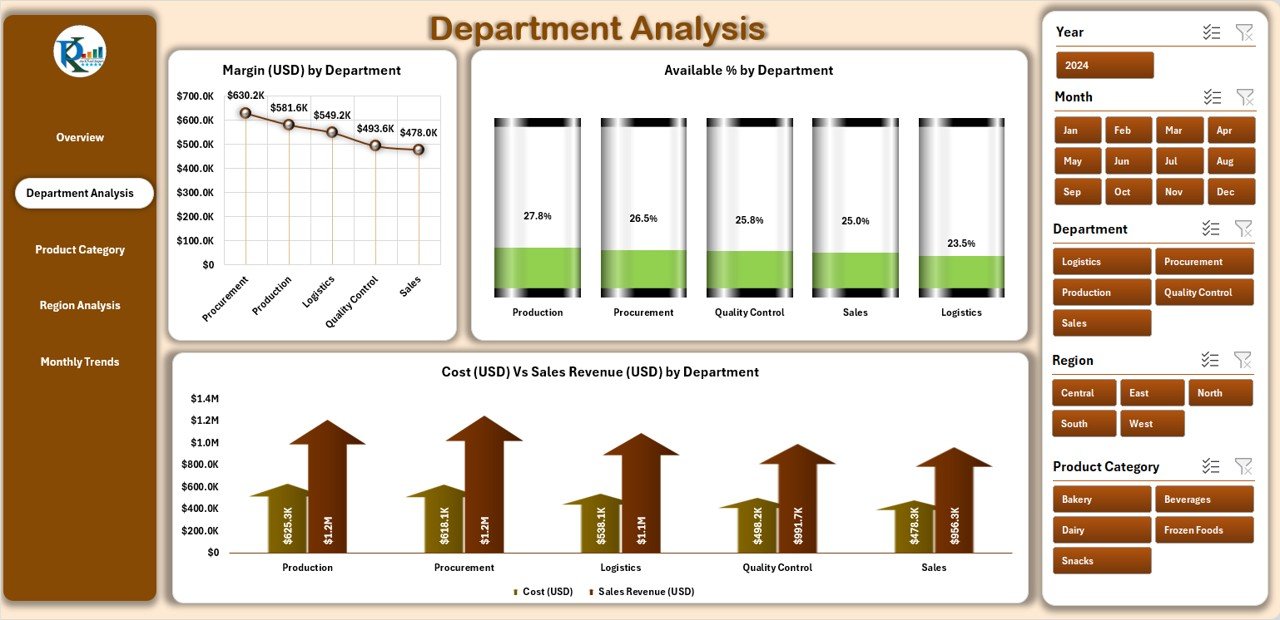
🏢 Department Analysis – Identify which departments are driving profit and which need cost control.
-
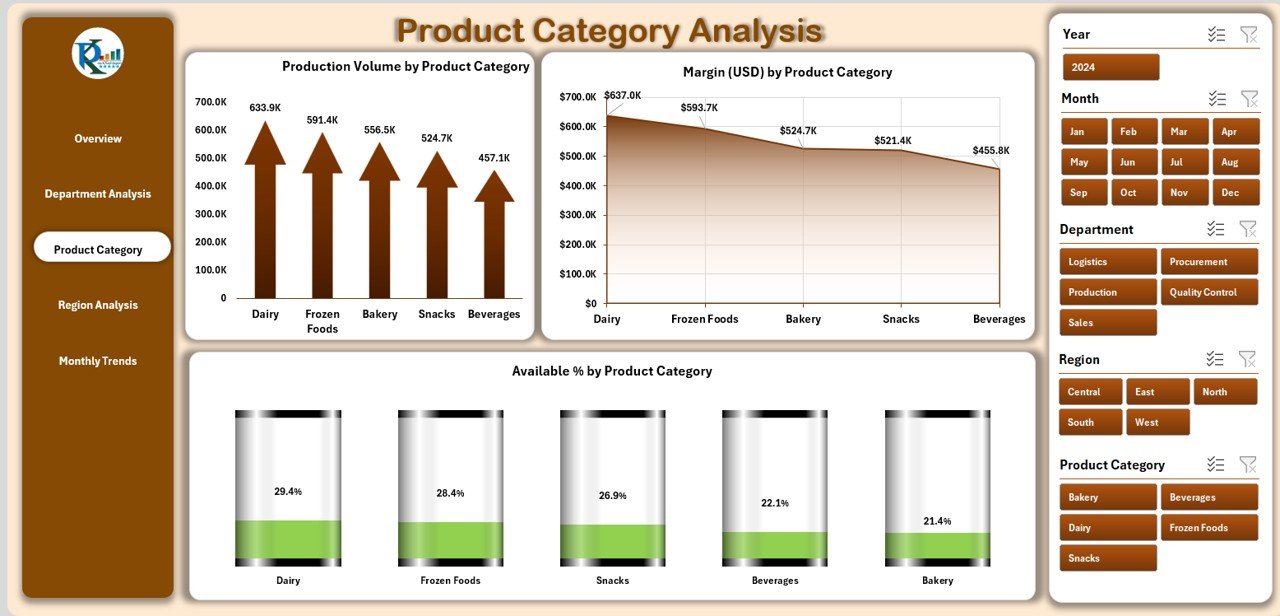
🍴 Product Category Analysis – Drill down into category-level production, availability, and profitability.
-
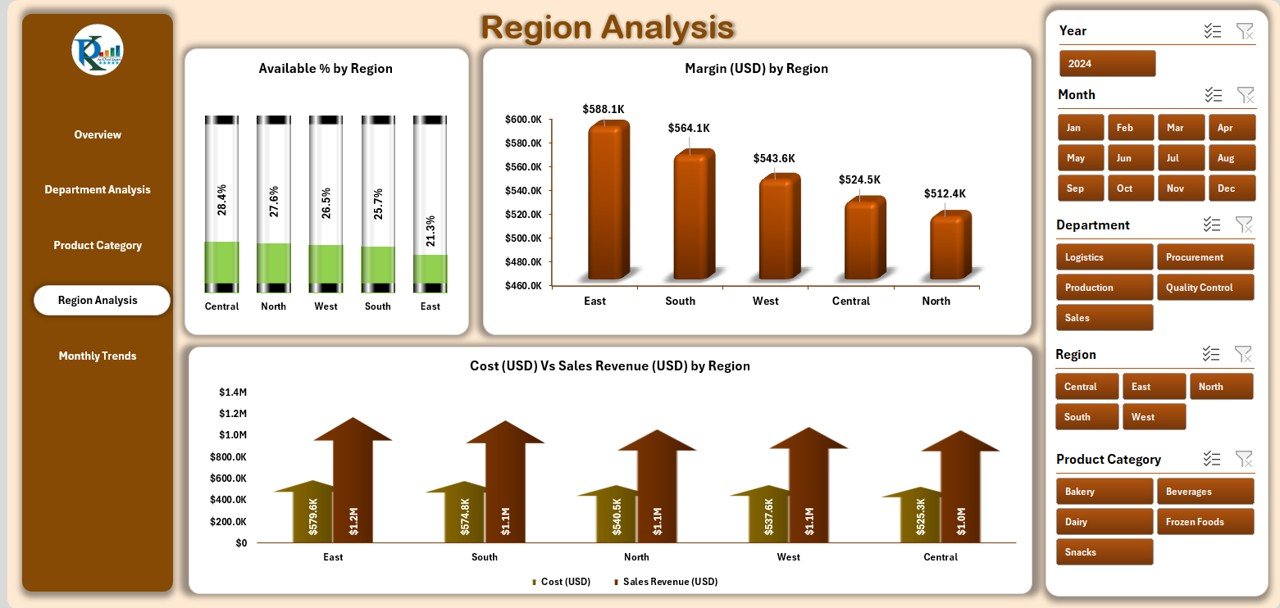
🌍 Region Analysis – Compare performance across regions to identify strong and weak markets.
-
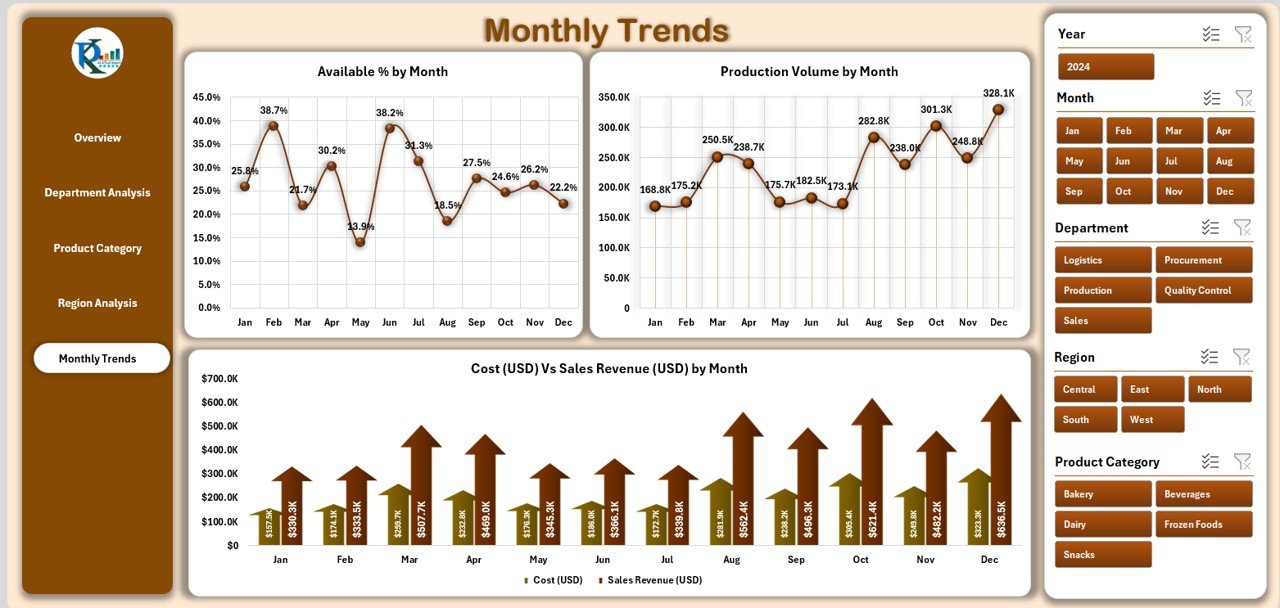
📆 Monthly Trends – Spot seasonal trends, track monthly revenue, and align production with demand.
-
📂 Data & Support Sheets – Simple structure for updating raw data and reference lists.
-
⚡ Excel-Powered Visuals – Pivot tables, charts, and slicers provide interactive analysis.
-
🎨 User-Friendly Design – Clean layout, easy navigation, and dynamic filtering for quick decisions.
📂 What’s Inside the Food and Beverage Dashboard
This template comes prebuilt with five powerful analytical pages and supporting sheets:
-
Overview Page – The central hub with navigation, slicers, and high-level KPIs.
-
Department Analysis – Focused view of cost, revenue, availability %, and margin contribution.
-
Product Category Analysis – Production volume, availability %, and profit margins by product category.
-
Region Analysis – Insights into availability, margins, and cost efficiency by region.
-
Monthly Trends – Seasonal and month-over-month analysis for smarter planning.
-
Data Sheet – Stores all operational and financial data (update anytime).
-
Support Sheet – Houses dropdown values and formula support to keep the dashboard dynamic.
🛠 How to Use the Food and Beverage Dashboard
-
Download & Open the template in Excel.
-
Load Your Data into the Data Sheet.
-
Navigate Pages using the built-in menu to switch between analyses.
-
Apply Filters with slicers for department, region, product, or month.
-
Refresh PivotTables to update all visuals instantly.
-
Analyze & Decide – Use insights to control costs, boost profitability, and optimize production.
👥 Who Can Benefit from This Food and Beverage Dashboard
This Excel dashboard is versatile and built for the entire food and beverage industry:
-
🍽 Restaurants & Cafés – Track daily sales, food costs, and menu profitability.
-
🏨 Hotels & Resorts – Manage revenues from multiple outlets like banquet halls, restaurants, and bars.
-
🏭 Food Manufacturers – Monitor production volume, cost efficiency, and demand fulfillment.
-
🛒 Retailers & Distributors – Analyze category sales across different outlets and regions.
-
👨💼 F&B Managers – Gain a 360° view of operations for data-driven decisions.
📌 Click here to read the Detailed blog post
Visit our YouTube channel to learn step-by-step video tutorials


Reviews
There are no reviews yet.