Managing a fleet of vehicles efficiently requires continuous monitoring of fuel consumption, maintenance expenses, mileage performance, and vehicle utilization. However, many organizations still rely on scattered spreadsheets or manual reports to track fleet operations. As a result, fleet managers often struggle to analyze vehicle performance, identify operational issues, and control costs effectively.
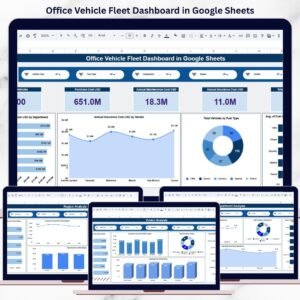
The Fleet Management Dashboard in Google Sheets provides a powerful and ready-to-use analytics solution that transforms raw fleet data into clear and actionable insights. This professionally designed dashboard allows organizations to track vehicle activity, monitor fuel costs, evaluate maintenance expenses, analyze mileage trends, and measure fleet utilization in one centralized reporting system.
Built entirely in Google Sheets, this dashboard offers flexibility, collaboration, and ease of use. Fleet managers and operational teams can easily update the Data sheet, and the dashboard automatically refreshes charts and KPIs. Because the template uses interactive charts and automated calculations, organizations can quickly detect inefficiencies and take corrective action.
Whether you manage a small delivery fleet or a large transportation network, this dashboard simplifies fleet monitoring and enables data-driven fleet management decisions.
🚀 Key Feature of Fleet Management Dashboard in Google Sheets
🚗 Centralized Fleet Monitoring
Track all vehicle-related metrics including fuel costs, maintenance expenses, mileage, and utilization in one dashboard.
📊 Interactive Data Visualization
Multiple charts and visuals make it easy to analyze fleet performance quickly.
📈 Comprehensive KPI Cards
Instantly monitor key indicators such as Total Cost, Fuel Cost, Maintenance Cost, Mileage, and Fuel Efficiency.
🗂 Multi-Page Fleet Analytics
Separate analysis pages provide insights by Department, Vehicle Type, Region, and Monthly Trends.
📅 Monthly Trend Analysis
Track changes in fleet performance across months to identify seasonal trends.
🔎 Search and Data Tracking
Quickly locate vehicle records using the built-in search functionality.
⚡ Automatic Dashboard Updates
Update the Data sheet and all charts and metrics update automatically.
🌐 Google Sheets Collaboration
Share the dashboard with teams and collaborate in real time.
📦 What’s Inside the Fleet Management Dashboard in Google Sheets
This ready-to-use dashboard includes multiple analytical worksheet tabs designed to provide comprehensive fleet performance insights.
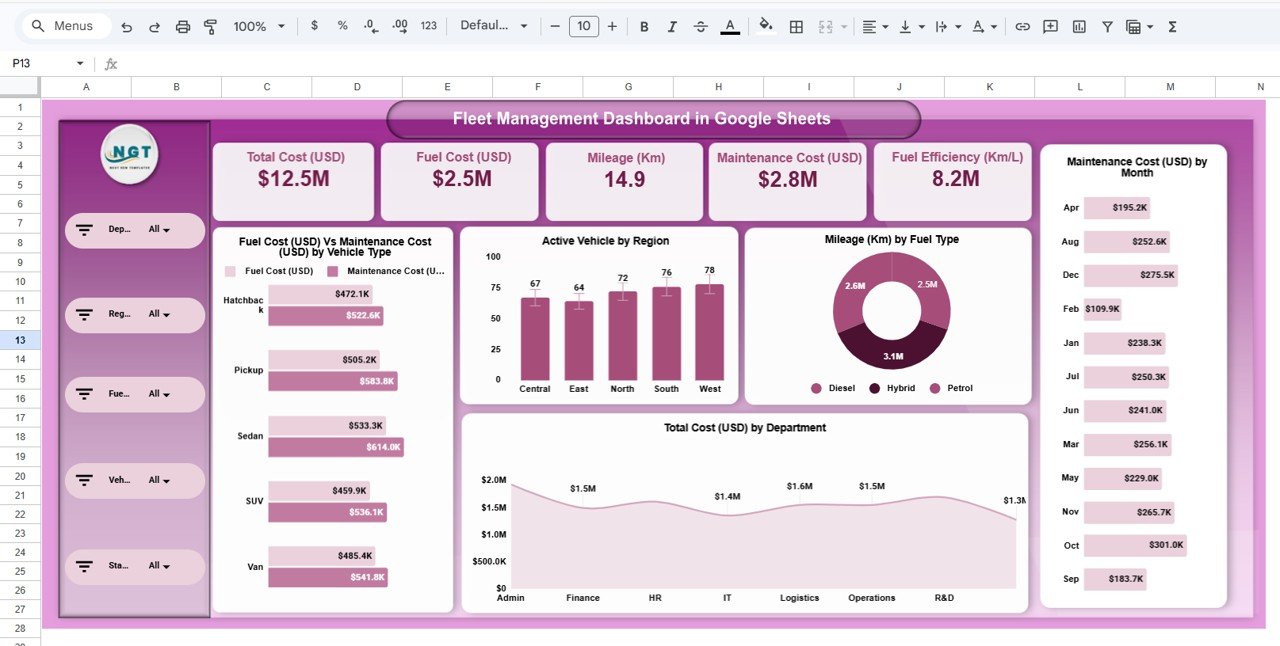
1️⃣ Overview Dashboard
The Overview Page provides a high-level summary of fleet performance.
This page includes several KPI cards displaying:
-
Total Cost (USD)
-
Fuel Cost (USD)
-
Maintenance Cost (USD)
-
Mileage (Km)
-
Fuel Efficiency (Km/L)
These metrics allow managers to quickly understand overall fleet health.
Charts available on this page include:
-
Fuel Cost vs Maintenance Cost by Vehicle Type
-
Active Vehicles by Region
-
Mileage by Fuel Type
-
Maintenance Cost by Month
-
Total Cost by Department
Because these visuals update automatically, fleet managers can immediately identify cost drivers and operational patterns.
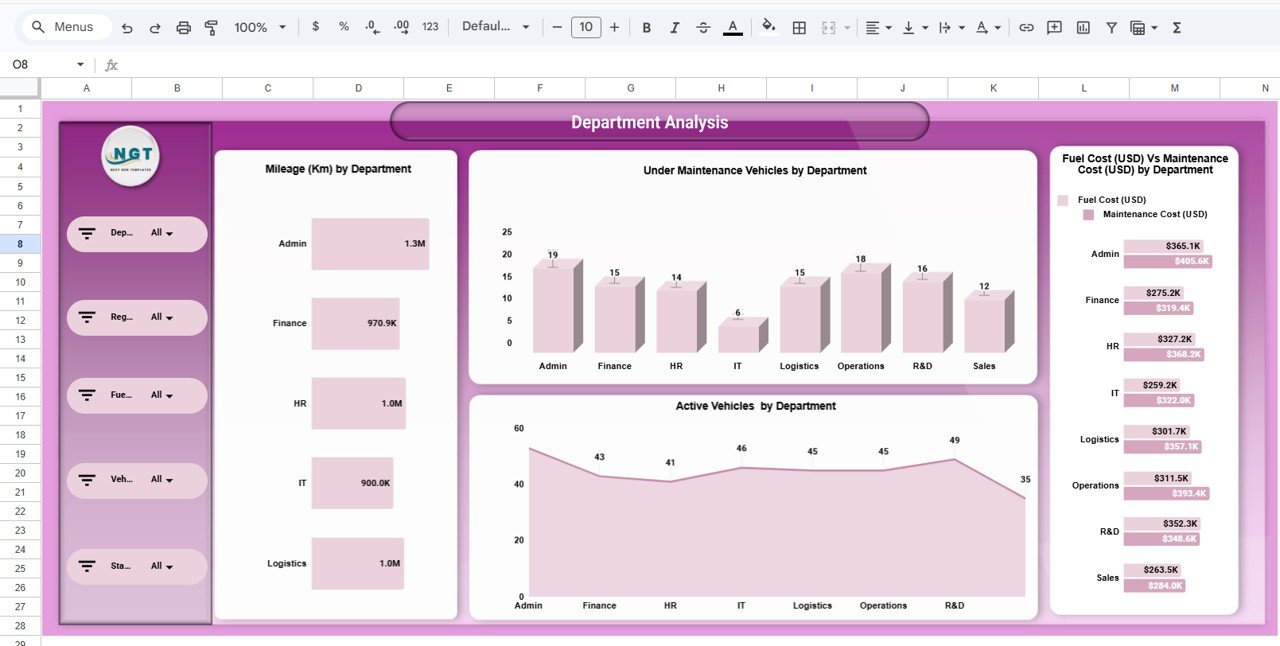
2️⃣ Department Analysis Dashboard
The Department Analysis Page focuses on vehicle usage across departments.
Charts include:
-
Mileage by Department
-
Vehicles Under Maintenance by Department
-
Active Vehicles by Department
-
Fuel Cost vs Maintenance Cost by Department
This page helps organizations identify which departments generate the most vehicle usage and maintenance costs.
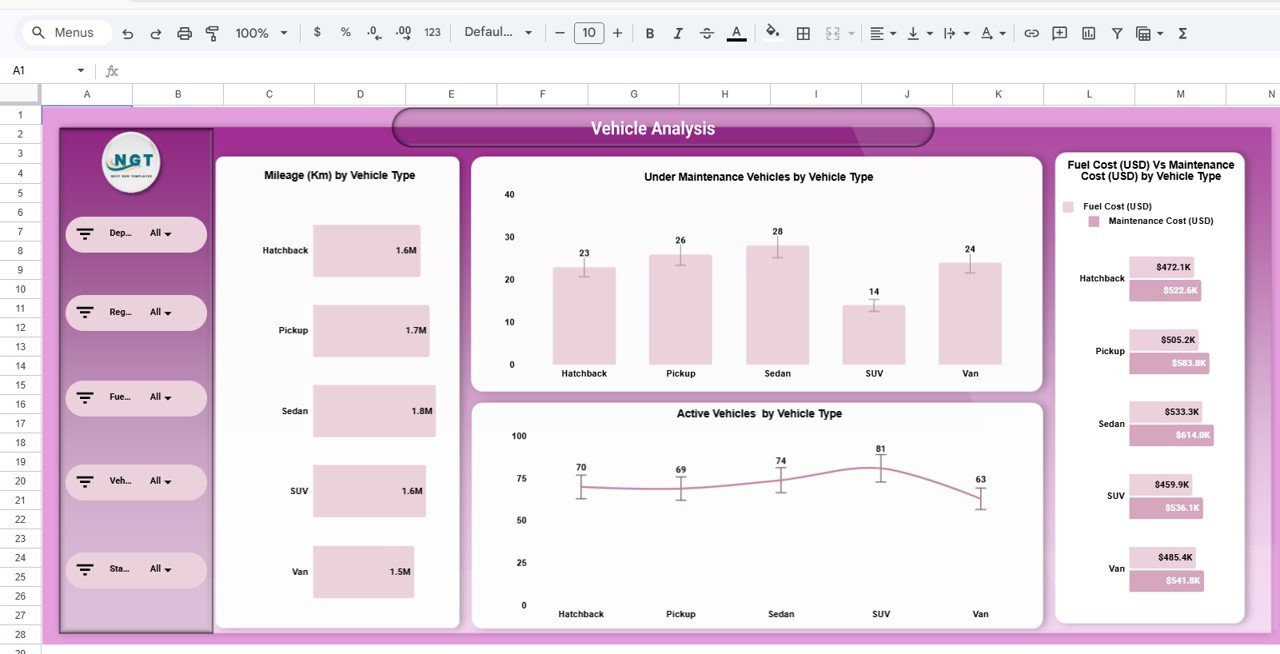
3️⃣ Vehicle Analysis Dashboard
The Vehicle Analysis Page evaluates performance based on vehicle types.
Charts include:
-
Mileage by Vehicle Type
-
Vehicles Under Maintenance by Vehicle Type
-
Active Vehicles by Vehicle Type
-
Fuel Cost vs Maintenance Cost by Vehicle Type
Fleet managers can analyze which vehicle types perform best and which require frequent maintenance.
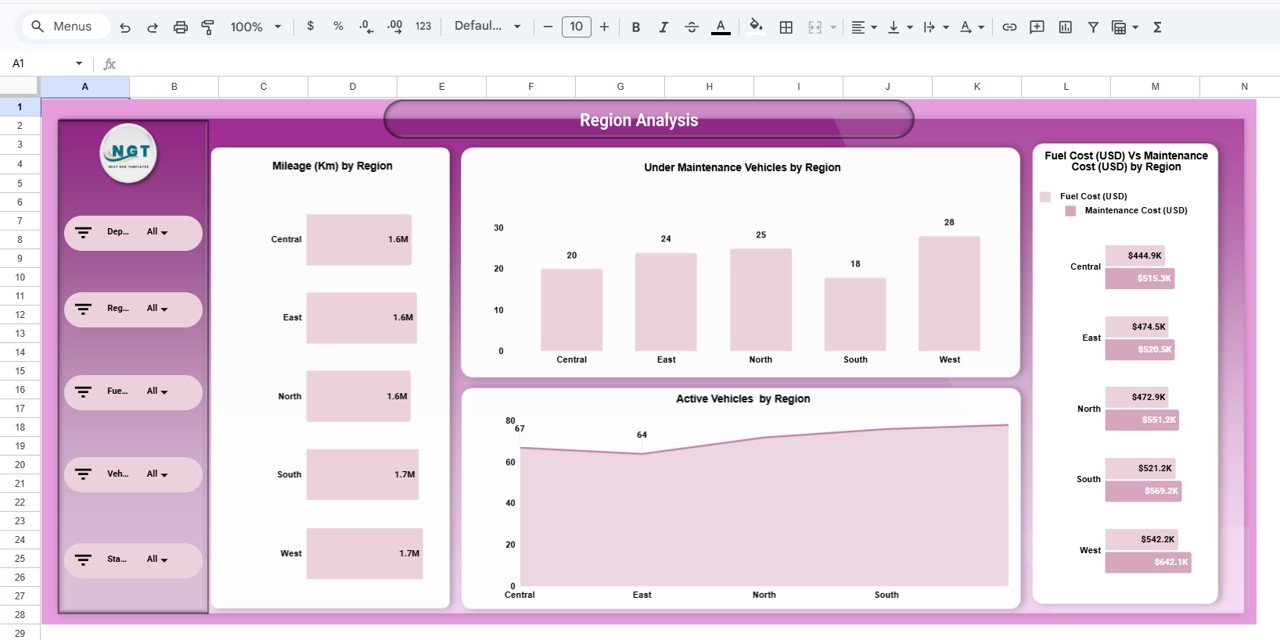
4️⃣ Region Analysis Dashboard
The Region Analysis Page helps organizations evaluate fleet performance across different geographical regions.
Charts include:
-
Mileage by Region
-
Vehicles Under Maintenance by Region
-
Active Vehicles by Region
-
Fuel Cost vs Maintenance Cost by Region
This page provides insights into regional fleet usage and maintenance requirements.
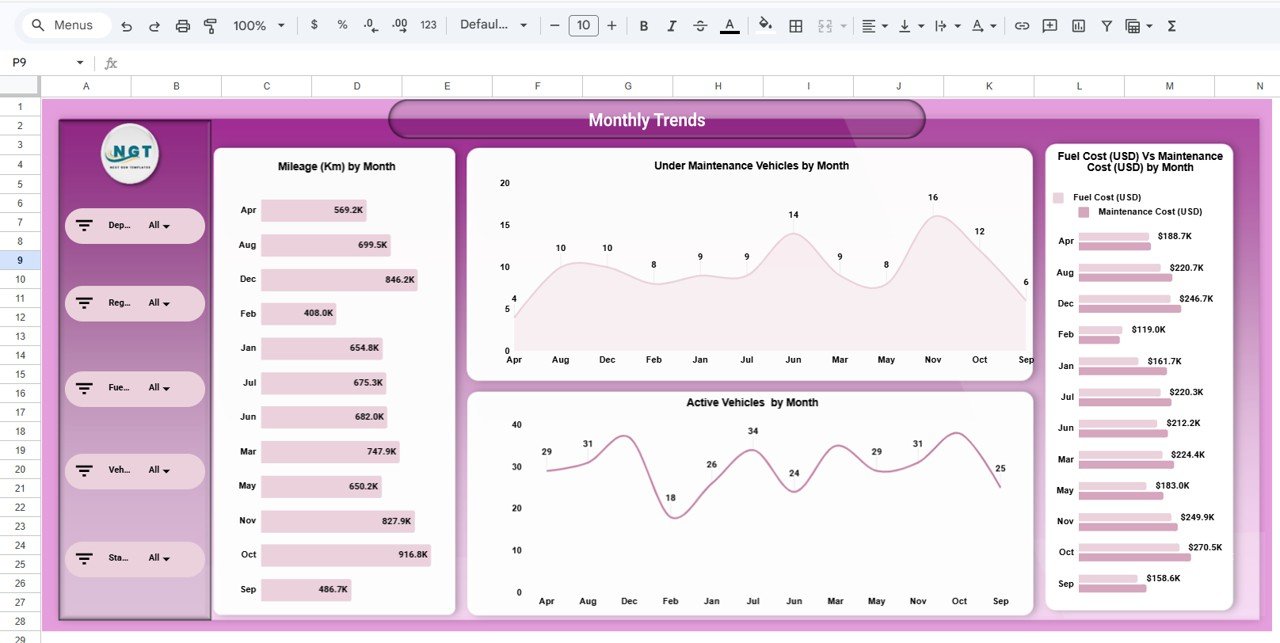
5️⃣ Monthly Trends Dashboard
Fleet performance changes over time, making trend analysis essential.
The Monthly Trends Page tracks fleet activity across months using charts such as:
-
Mileage by Month
-
Vehicles Under Maintenance by Month
-
Active Vehicles by Month
-
Fuel Cost vs Maintenance Cost by Month
This page helps identify seasonal fleet usage and cost fluctuations.
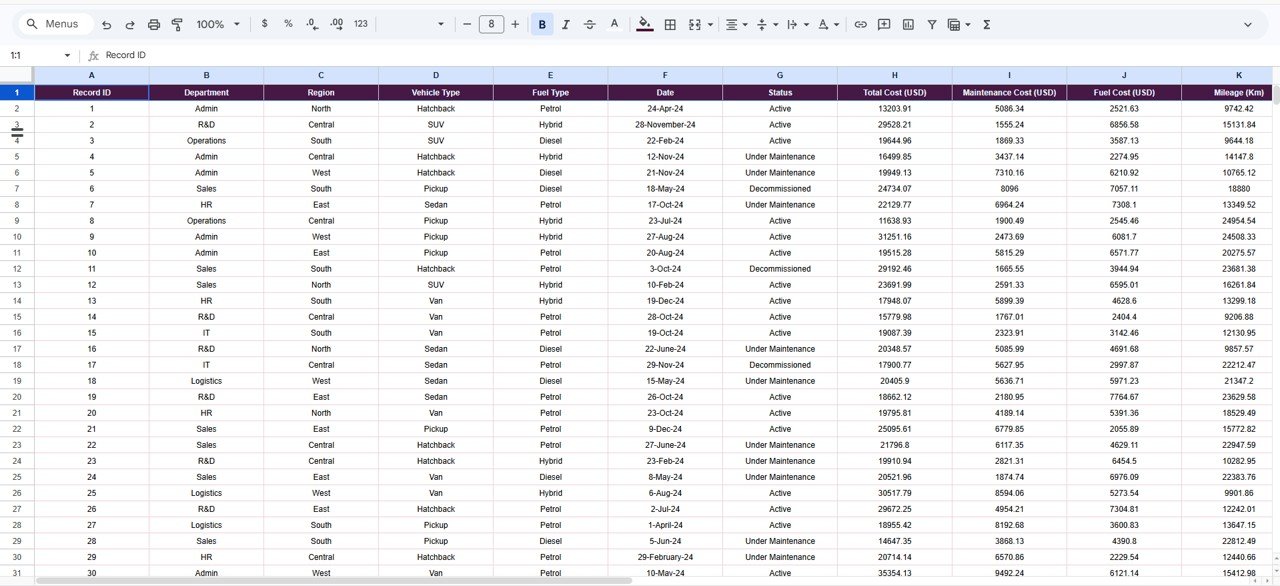
6️⃣ Data Sheet
The Data Sheet serves as the central data source for the dashboard.
Users enter fleet data fields such as:
-
Record ID
-
Department
-
Region
-
Vehicle Type
-
Fuel Type
-
Date
-
Status
-
Total Cost
-
Fuel Cost
-
Maintenance Cost
-
Mileage
-
Fuel Efficiency
-
Trips Completed
Once data is entered, the dashboard automatically updates all charts and KPIs.
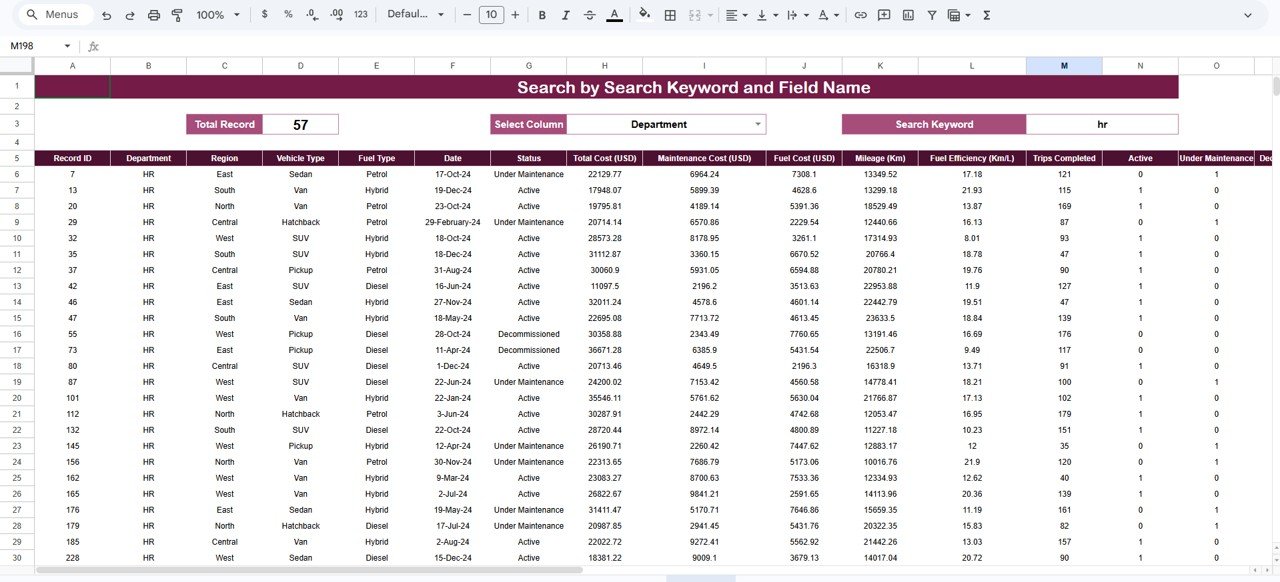
7️⃣ Search Dashboard
The template also includes a Search Page that allows users to locate specific fleet records quickly.
Users can select a column, enter a keyword, and instantly filter relevant fleet data.
⚙️ How to Use the Fleet Management Dashboard in Google Sheets
Using the dashboard is simple and requires minimal technical knowledge.
1️⃣ Download and open the Fleet Management Dashboard template in Google Sheets.
2️⃣ Enter your fleet records into the Data sheet.
3️⃣ Maintain the same column structure while updating data.
4️⃣ Refresh or reopen the file.
5️⃣ The dashboard will automatically update all charts, slicers, and KPIs.
Within minutes, you will have a fully interactive fleet analytics dashboard ready for monitoring.
🎯 Who Can Benefit from This Fleet Management Dashboard in Google Sheets
This dashboard is useful for organizations that manage vehicle fleets.
🚚 Logistics Companies – Track delivery vehicle performance and fuel costs.
🚛 Transportation Providers – Monitor fleet efficiency and maintenance schedules.
📦 Delivery Services – Analyze vehicle usage and operational expenses.
🏗 Construction Companies – Track heavy vehicle utilization and maintenance.
🏢 Corporate Fleet Managers – Monitor company vehicles and reduce operational costs.
🏛 Government Transport Departments – Manage public service fleets effectively.
Because the dashboard simplifies fleet monitoring and cost tracking, it becomes a powerful operational tool for organizations.
Click here to read the Detailed blog post
Watch the step-by-step video tutorial: