Modern fertilizer manufacturing requires precision, efficiency, and continuous performance monitoring. Production plants must manage output levels, raw material utilization, energy consumption, quality compliance, and operational costs simultaneously. However, many organizations still rely on disconnected spreadsheets and manual reporting systems, making performance tracking slow and inefficient.
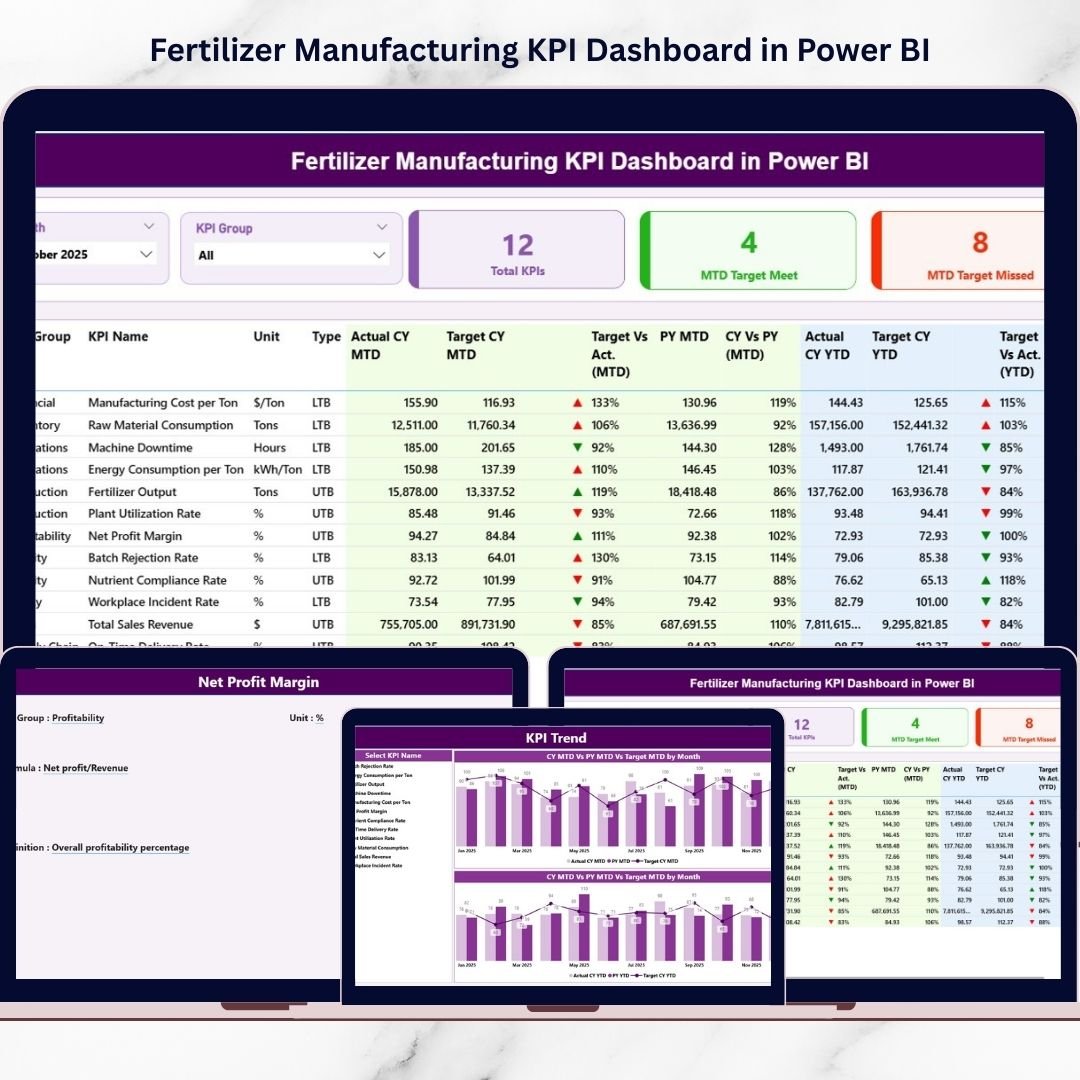
The Fertilizer Manufacturing KPI Dashboard in Power BI is a ready-to-use, professionally designed analytics solution that transforms complex manufacturing data into clear, interactive insights. Instead of spending hours compiling reports, decision-makers can instantly monitor KPIs through dynamic visuals, automated calculations, and powerful comparisons — all within one centralized dashboard.
Built using Power BI with an Excel-based data source, this dashboard enables organizations to track Month-To-Date (MTD) and Year-To-Date (YTD) performance, compare targets vs actual results, and analyze historical trends effortlessly. Whether you manage plant operations or oversee strategic decisions, this dashboard helps you move from reactive reporting to proactive performance management.
🚀 Key Feature of Fertilizer Manufacturing KPI Dashboard in Power BI
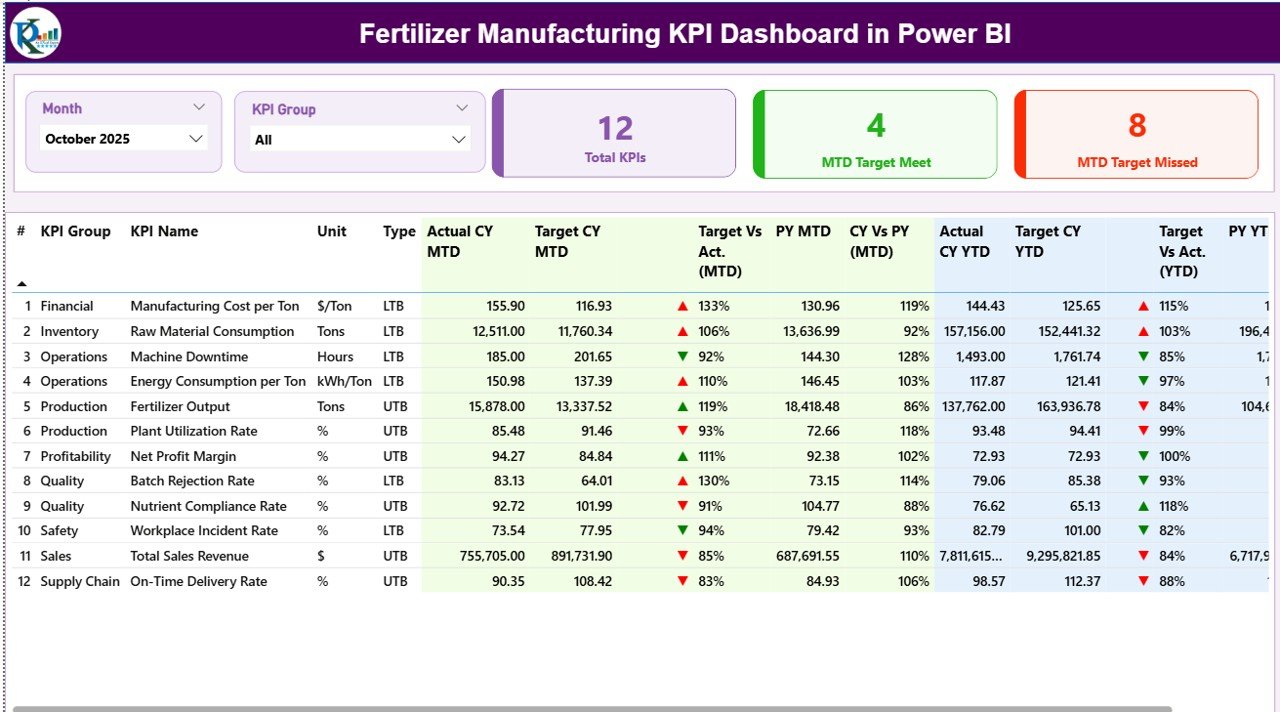
📊 Interactive Summary Dashboard
Monitor overall performance using KPI cards, filters, and structured tables for quick operational insights.
🎯 MTD & YTD Performance Tracking
Analyze both short-term and long-term performance simultaneously for better decision-making.
📅 Dynamic Month & KPI Group Slicers
Instantly filter data without editing datasets or rebuilding reports.
📈 Automated Target vs Actual Comparison
Quickly identify KPIs meeting or missing targets using visual indicators.
🔁 Previous Year Performance Analysis
Compare current results with historical data to evaluate improvement trends.
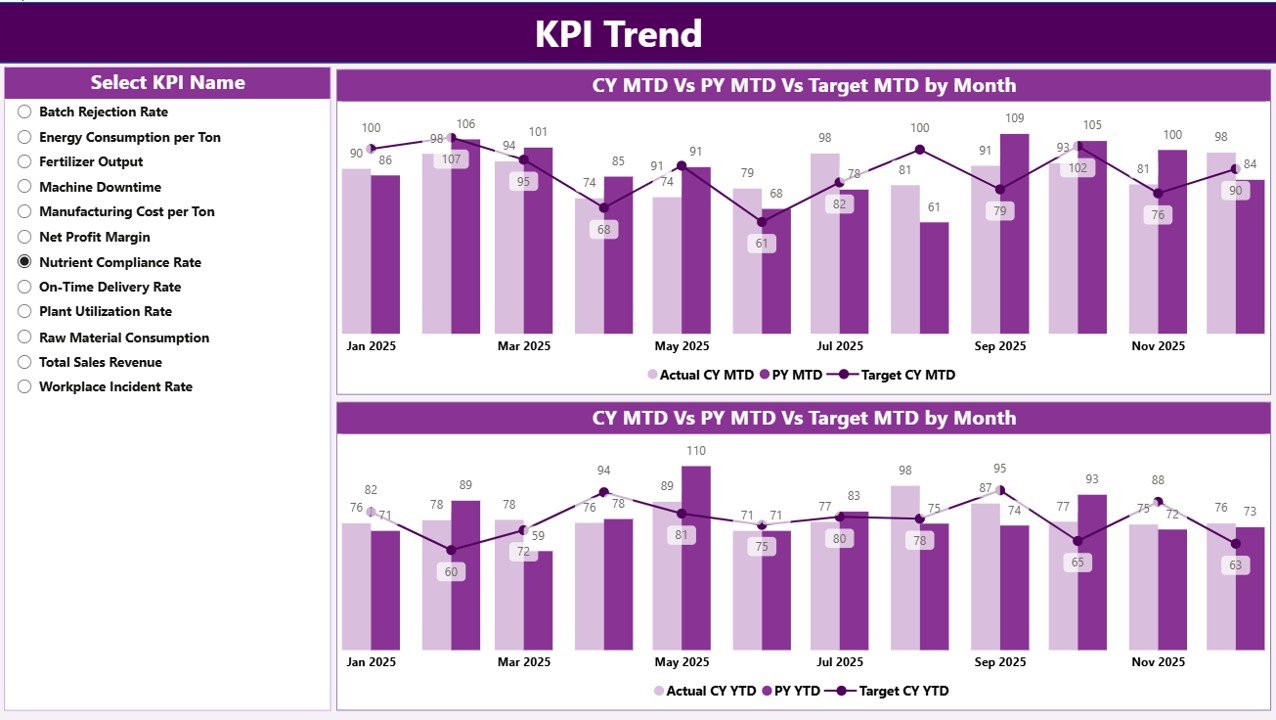
📉 KPI Trend Analysis Page
Visual combo charts display performance behavior over time for deeper analysis.
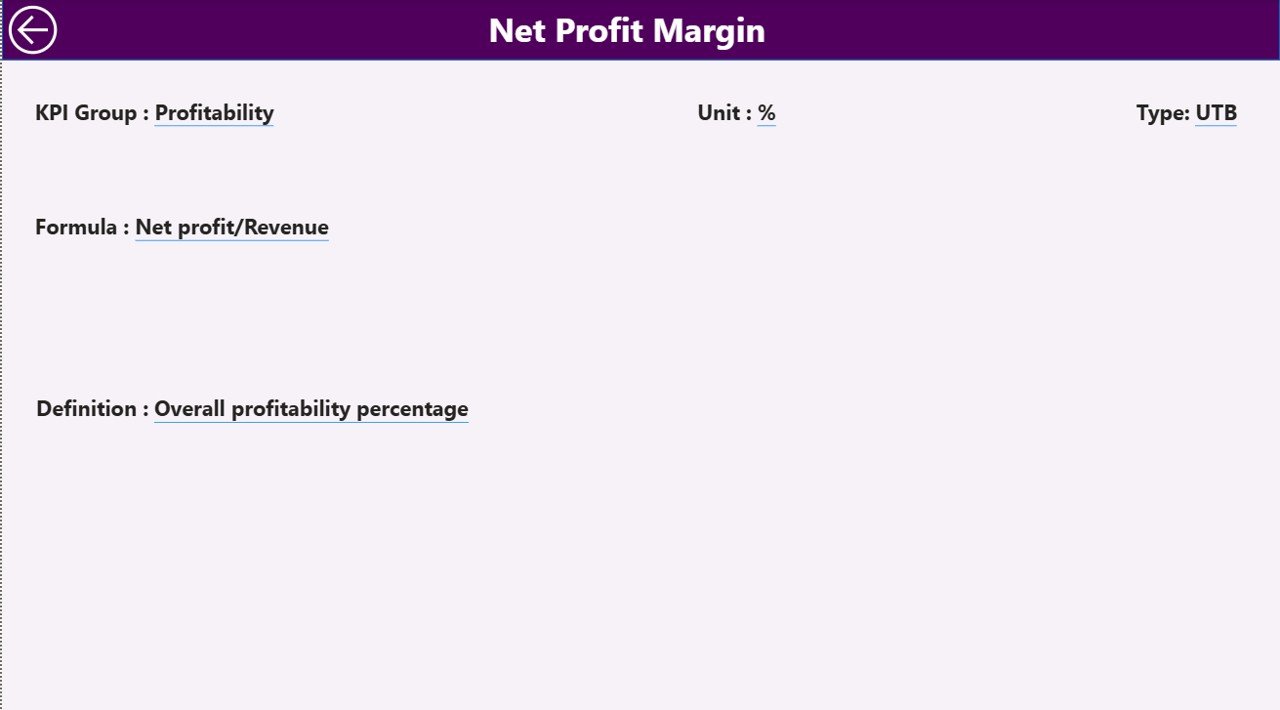
📘 KPI Definition Drill-Through Page
Understand KPI formulas, definitions, and measurement units directly inside the dashboard.
⚡ Excel-Based Data Update System
Simply update Excel files and refresh Power BI — no redesign required.
📦 What’s Inside the Fertilizer Manufacturing KPI Dashboard in Power BI
When you download this product, you receive a fully structured performance monitoring system including:
✅ Power BI Dashboard File with 3 Interactive Pages
-
Summary Page (Main KPI Overview)
-
KPI Trend Analysis Page
-
KPI Definition Drill-Through Page
✅ Structured Excel Data Source Files
-
Input Actual Data Sheet
-
Input Target Data Sheet
-
KPI Definition Master Sheet
✅ Prebuilt KPI Calculations and Visual Indicators
✅ Automated MTD & YTD Metrics
✅ Target Achievement Status Icons (▲ ▼)
✅ Professional Manufacturing KPI Layout
The dashboard is ready to use immediately — just update your data and refresh.
🛠️ How to Use the Fertilizer Manufacturing KPI Dashboard in Power BI
Using this dashboard is simple and requires no advanced Power BI expertise:
1️⃣ Enter actual performance values in the Excel Input_Actual sheet.
2️⃣ Add monthly targets in the Input_Target sheet.
3️⃣ Maintain KPI details in the KPI Definition sheet.
4️⃣ Open the Power BI file and refresh the dataset.
5️⃣ Select Month or KPI Group using slicers.
6️⃣ Instantly analyze performance insights and trends.
Within minutes, your manufacturing data converts into executive-level analytics.
👥 Who Can Benefit from This Fertilizer Manufacturing KPI Dashboard in Power BI
This dashboard is designed for professionals across fertilizer manufacturing operations:
🏭 Plant Managers monitoring production efficiency
📊 Operations Teams tracking daily performance
✅ Quality Control Departments analyzing compliance metrics
💰 Finance Teams evaluating operational costs
🚚 Supply Chain Managers improving delivery performance
👨💼 Senior Executives making strategic decisions
📈 Business Analysts conducting performance reviews
Whether you operate a single plant or multiple facilities, this dashboard provides a unified performance view.
By implementing this dashboard, organizations gain real-time visibility, reduce reporting time, improve accountability, and enable data-driven decision-making. Instead of searching for problems in spreadsheets, teams focus on improving performance and achieving operational excellence.
### Click here to read the Detailed blog post
Visit our YouTube channel to learn step-by-step video tutorials:
👉 https://youtube.com/@PKAnExcelExpert


