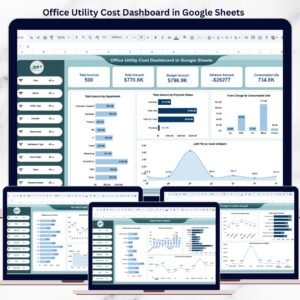
Take your farm management to the next level with the Farm Production and Profitability Dashboard in Google Sheets — a smart, practical, and ready-to-use solution designed for modern farmers and agribusinesses. In today’s agriculture industry, managing production, costs, revenue, crop yield, and profitability through scattered spreadsheets can quickly become confusing and time-consuming. Important insights often get missed, and delayed decisions can reduce farm performance. That is why this dashboard is built to bring all your critical farm data into one interactive and easy-to-manage Google Sheets system. Instead of guessing what is working and what is not, you can track performance clearly, compare results across regions, crops, soil types, and seasons, and make better decisions with confidence. If you want to improve farm efficiency, increase profits, and simplify reporting, this dashboard is the perfect tool for your business.
Key Feature of Farm Production and Profitability Dashboard in Google Sheets
🌾 Interactive Farm Performance Dashboard – Get a complete snapshot of your farm’s production and profitability in one centralized Google Sheets dashboard.
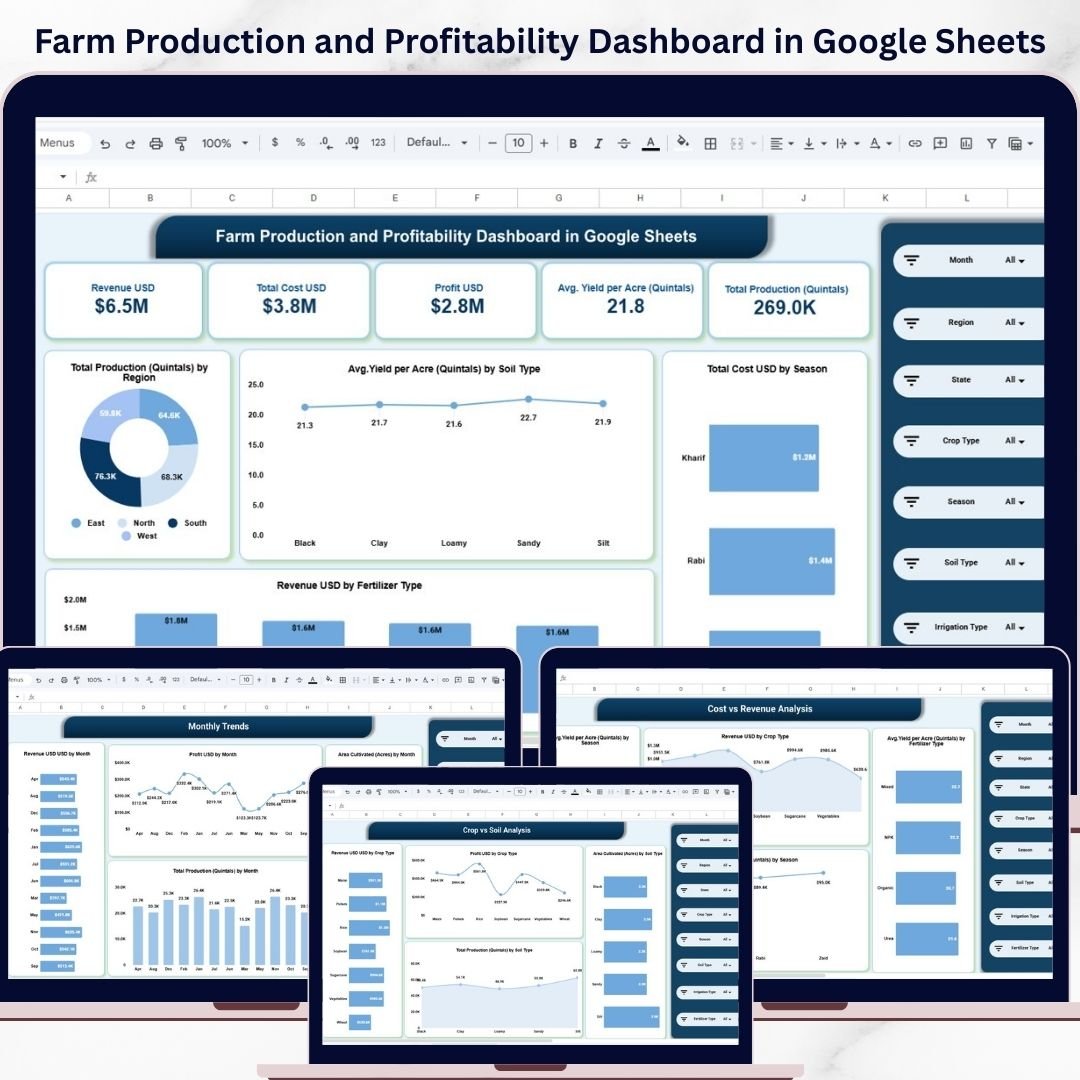
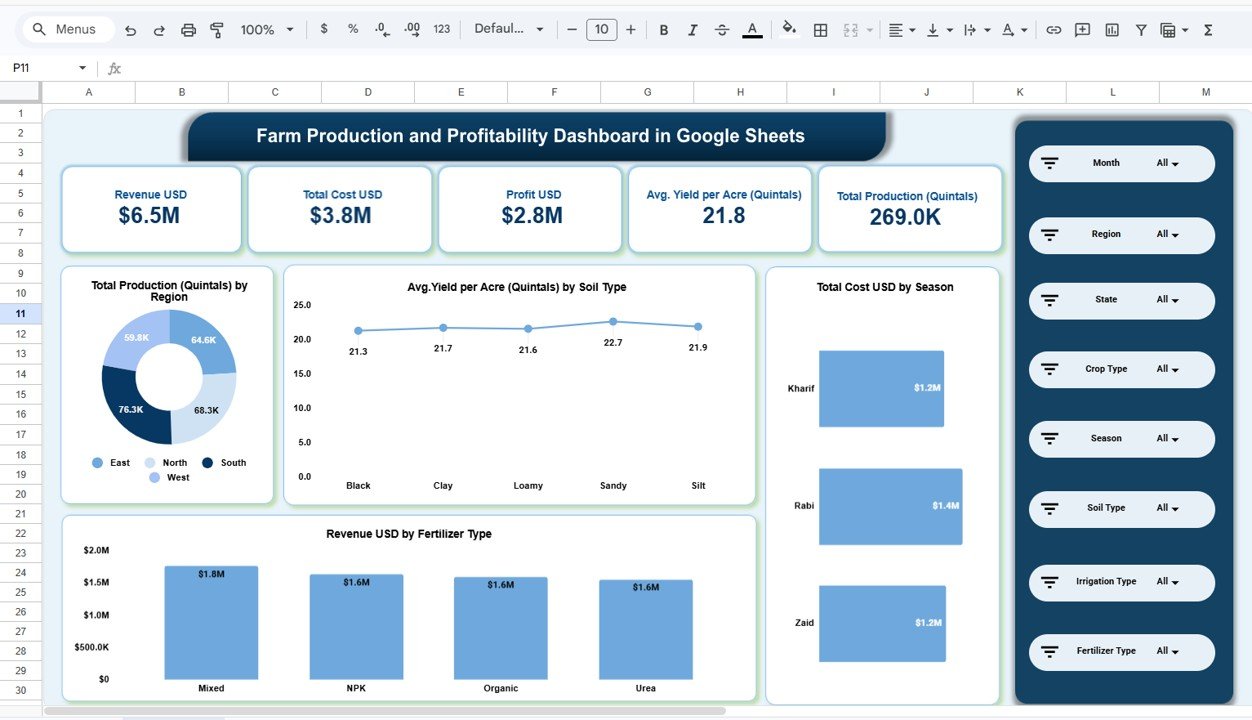
📊 Powerful KPI Overview – Instantly monitor important KPIs such as Revenue, Total Cost, Profit, Average Yield per Acre, and Total Production.
📈 Overview Charts for Quick Insights – Analyze Production by Region, Yield by Soil Type, Cost by Season, and Revenue by Fertilizer Type in a clear visual format.
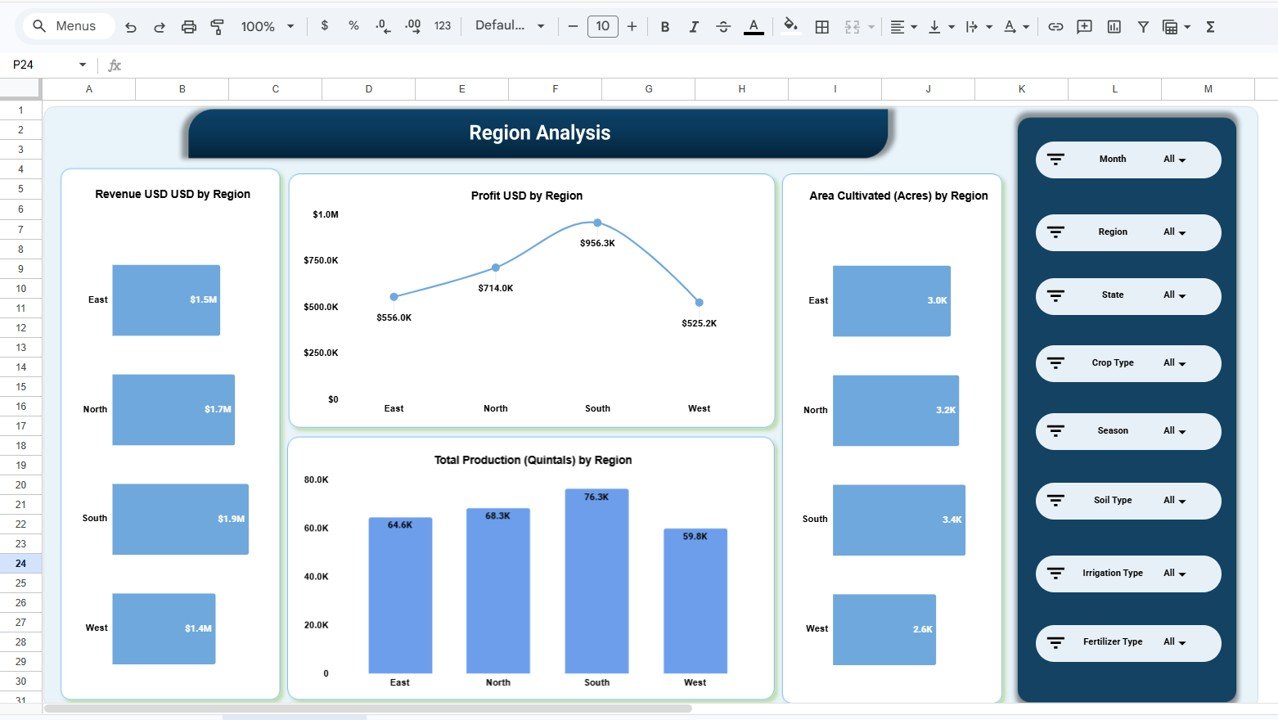
🌍 Region Analysis Page – Compare revenue, profit, area cultivated, and production by region to identify the best-performing locations.
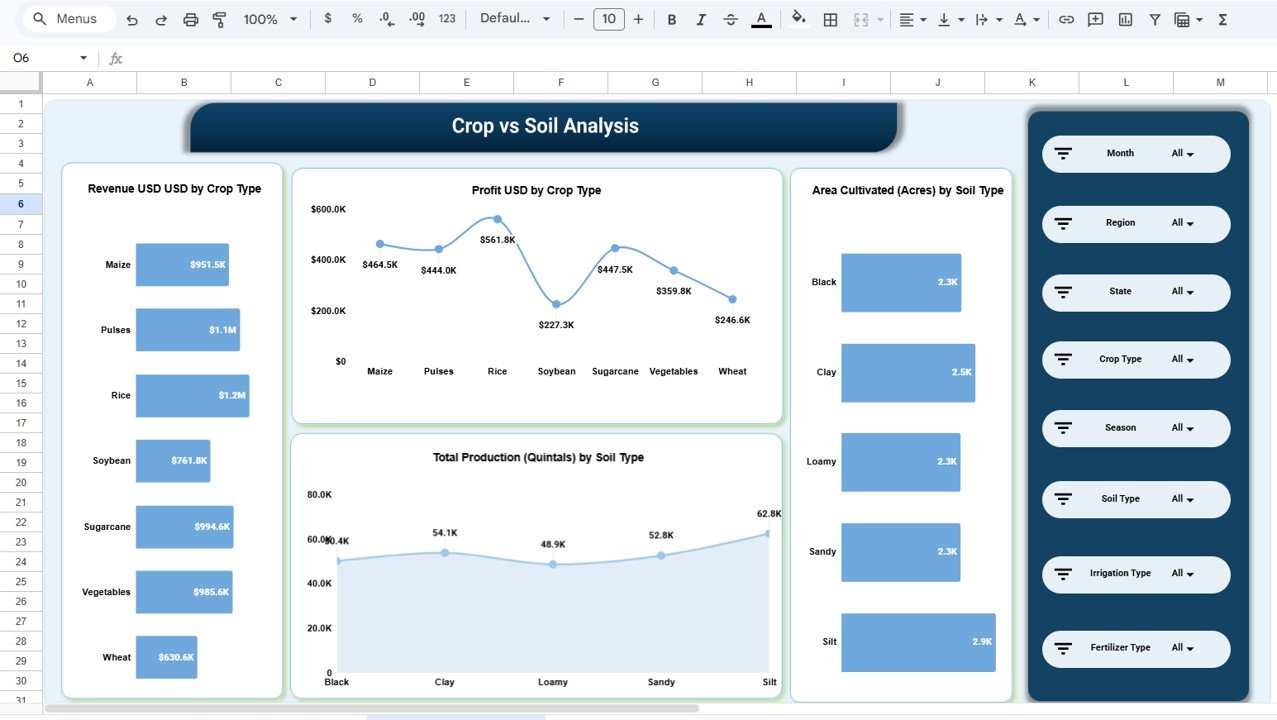
🌱 Crop vs Soil Analysis – Discover which crop types perform best across different soil conditions and uncover the most profitable crop combinations.
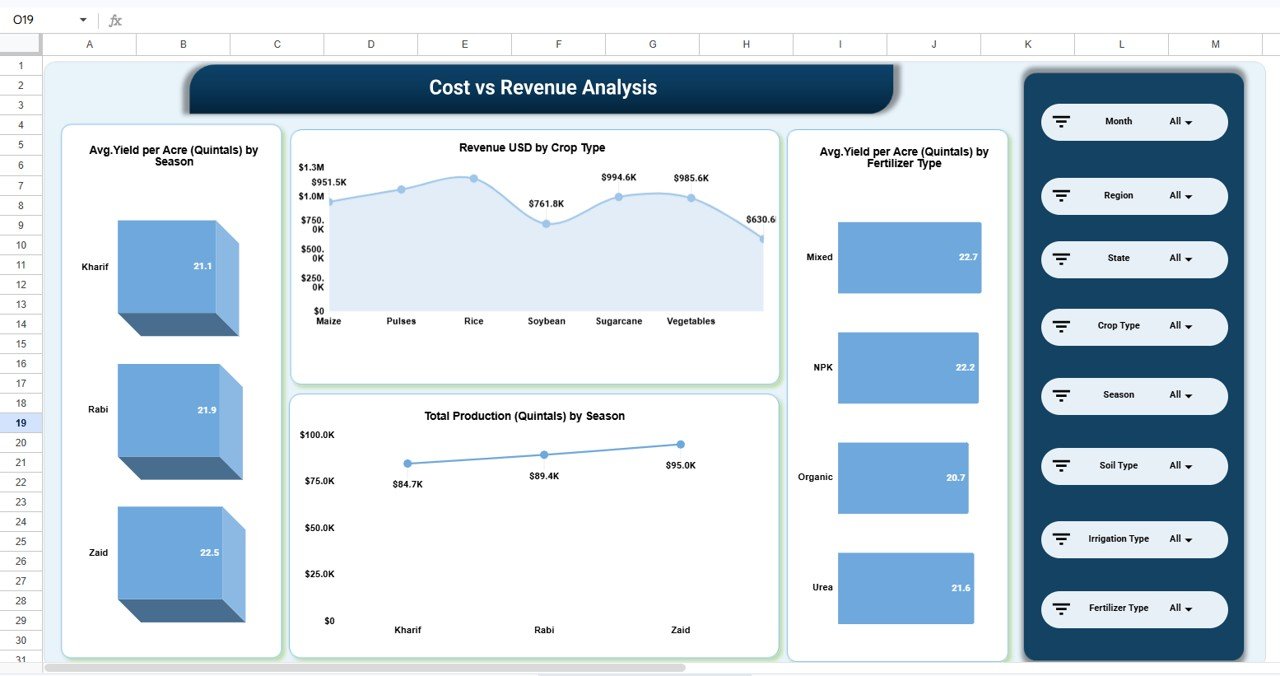
💰 Cost vs Revenue Analysis – Evaluate yield by season, revenue by crop type, production by season, and yield by fertilizer type to improve farm profitability.
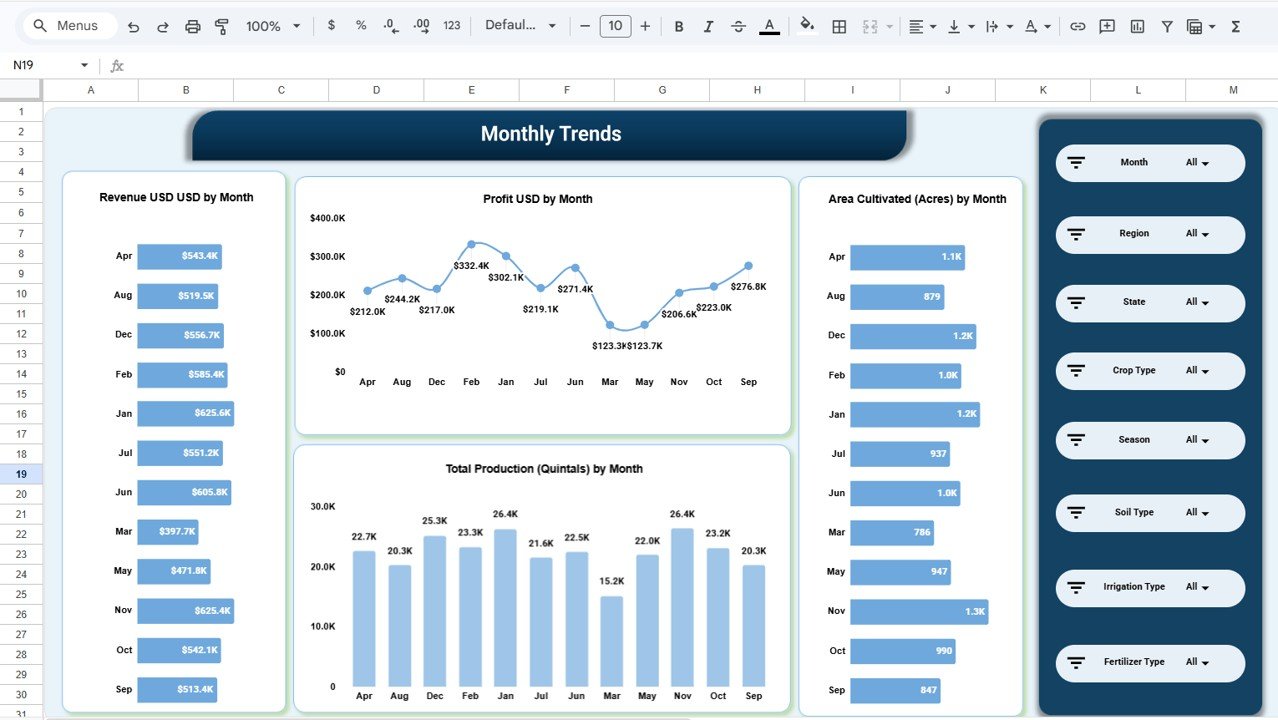
📅 Monthly Trends Page – Track revenue, profit, cultivated area, and production by month to understand seasonal performance patterns.
🎛️ Easy Filtering and Analysis – Use Google Sheets filters, formulas, and dynamic visuals to interact with the data and focus on what matters most.
⚙️ Fully Editable and Customizable – Adjust crops, regions, seasons, formulas, and categories to match your own farm operations.
🚀 Practical Tool for Smarter Farming – Turn raw agricultural data into useful insights that help improve productivity, planning, and profitability.
What’s Inside the Farm Production and Profitability Dashboard in Google Sheets
Inside this digital product, you get a complete farm reporting dashboard built to help you monitor and analyze agricultural operations with clarity. This dashboard is designed for farmers, agribusiness owners, farm managers, and agricultural consultants who want to track farm performance in a more organized and visual way.
The dashboard includes multiple interactive analysis pages that focus on different parts of your farm business.
The Overview Dashboard gives you a quick summary of total farm performance. It highlights important KPIs like Revenue, Total Cost, Profit, Average Yield per Acre, and Total Production, along with charts that help you understand big-picture results.
The Region Analysis Page allows you to compare how each geographic area is performing. This helps users identify the strongest regions, the most profitable areas, and land utilization opportunities.
The Crop vs Soil Analysis Page helps you match crop performance with soil conditions. This makes it easier to identify which crops are best suited for different soil types and which combinations generate better returns.
The Cost vs Revenue Analysis Page focuses on profitability and operational performance. It helps users review crop-based revenue, seasonal yield, fertilizer impact, and production trends.
The Monthly Trends Page provides a time-based view of farm operations, helping you understand monthly changes in revenue, profit, production, and cultivated area.
As a result, this dashboard gives you a centralized and easy-to-use reporting tool for smarter agricultural management.
How to Use the Farm Production and Profitability Dashboard in Google Sheets
🚀 Start by entering your farm data into the Google Sheets source tables. Add information related to production, revenue, costs, crop types, soil type, regions, seasons, fertilizer use, and monthly records.
📊 Open the dashboard pages to review the visual summaries and KPI highlights.
🎛️ Apply filters such as Month, Region, Crop Type, Soil Type, or Season to focus on specific areas of farm performance.
🌍 Review the Region Analysis page to compare geographic performance and identify the most productive and profitable regions.
🌱 Use the Crop vs Soil Analysis page to understand which crops perform best in specific soil conditions.
💰 Explore the Cost vs Revenue Analysis page to evaluate profitability, control expenses, and improve financial results.
📅 Check the Monthly Trends page regularly to monitor seasonal changes, identify fluctuations, and support future farm planning.
💡 Use the insights in farm meetings, planning sessions, budgeting reviews, and growth strategies to make better farming decisions.
Who Can Benefit from This Farm Production and Profitability Dashboard in Google Sheets
👨🌾 Farm Owners who want better control over production, revenue, and profit
🏢 Agribusinesses that need a centralized dashboard for performance analysis
📊 Farm Managers who monitor daily operations, cost control, and yield performance
🌱 Agricultural Consultants who help clients improve productivity and profitability
💰 Financial Planning Teams who need clear reporting on farm revenue and costs
🌍 Regional Agriculture Teams who compare location-based performance
📈 Data-Driven Farmers who want smarter and faster decision-making
🚜 Small and Large Farms looking for an affordable and practical dashboard solution
This dashboard is more than just a spreadsheet. It is a valuable management tool that helps you simplify farm reporting, improve productivity, and increase profitability with confidence. If you want to stop relying on scattered files and start making smarter farming decisions, this dashboard is an excellent investment.
Click hare to read the Detailed blog post
Watch the step-by-step video tutorial:
Read the detailed blog post to explore the dashboard structure, analysis pages, features, and best practices in full detail.