


Running facility services without proper tracking is like navigating without a map. 🏢 Facility managers deal with multiple responsibilities—maintenance, cleaning, safety, space utilization, energy control, and employee services. Without a structured system, it becomes nearly impossible to control costs, ensure efficiency, and maintain high service standards.
That’s where the Facility Services KPI Dashboard in Excel comes in. 📊 This ready-to-use tool consolidates all facility management KPIs into one interactive dashboard. Instead of juggling endless spreadsheets, you get real-time insights, performance comparisons, and visual indicators that highlight where your facility operations stand.
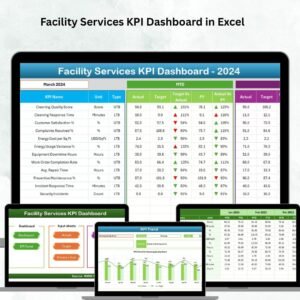
✨ Key Features of Facility Services KPI Dashboard in Excel
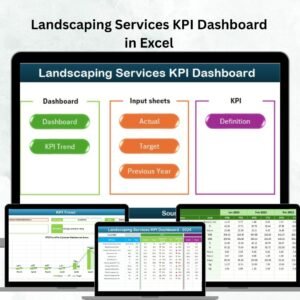
✔ 7 Pre-Built Sheets – Includes Home, Dashboard, KPI Trend, Actual Numbers, Target, Previous Year Numbers, and KPI Definition tabs.
✔ Dashboard Page – Month selector (cell D3) updates KPIs instantly with MTD and YTD performance.
✔ Trend Analysis – KPI Trend sheet provides Actual vs. Target vs. Previous Year insights with clear charts.
✔ KPI Metadata – Every KPI comes with definitions, formulas, units, and group classification for clarity.
✔ Conditional Formatting Arrows – Quickly see performance improvements or declines.
✔ Data Input Sheets – Organized spaces for Actual values, Targets, and Previous Year numbers.
✔ Easy Navigation – Home page with quick buttons saves time and improves user experience.
✔ Fully Customizable – Add, modify, or remove KPIs and adapt visuals to your organization’s needs.
📂 What’s Inside the Facility Services KPI Dashboard

🔹 Home Sheet – Acts as an index with navigation buttons.
🔹 Dashboard Sheet – Displays key KPIs, charts, and trend arrows.
🔹 KPI Trend Sheet – Drill into specific KPIs with dropdown selection.
🔹 Actual Numbers Sheet – Input monthly data with flexible start month setup.
🔹 Target Sheet – Store annual and monthly performance targets.
🔹 Previous Year Sheet – Add historical data for benchmarking improvements.
🔹 KPI Definition Sheet – Central repository of KPI details for consistency.
🛠️ How to Use the Facility Services KPI Dashboard
-
Open the Template – Works directly in Excel, no extra software needed.
-
Enter Actual Data – Record monthly values in the “Actual Numbers” sheet.
-
Set Targets – Input yearly or monthly goals in the “Target” sheet.
-
Add Historical Data – Use the “Previous Year” sheet for benchmarking.
-
Select Month – From the Dashboard, choose a month to update KPIs.
-
Analyze Performance – Compare Actual vs. Target vs. Previous Year.
-
Review Definitions – Refer to the KPI Definition sheet to maintain clarity.
👥 Who Can Benefit from This Dashboard?
✅ Facility Managers – Monitor service performance and efficiency.
✅ Operations Teams – Track maintenance, cleaning, and energy usage.
✅ Finance Departments – Compare costs vs. budgets.
✅ Safety & Compliance Officers – Ensure standards are being met.
✅ HR & Workplace Experience Teams – Improve employee satisfaction with better services.
✅ SMEs & Enterprises – Scalable for organizations of any size.
With the Facility Services KPI Dashboard in Excel, organizations can:
💡 Track KPIs like maintenance efficiency, energy consumption, safety compliance, and service response times.
💡 Identify issues before they escalate with trend arrows and performance cards.
💡 Centralize facility data in one file for collaboration.
💡 Save costs by using Excel instead of expensive FM software.
💡 Enhance decision-making with data-driven insights.
It’s more than just a reporting sheet—it’s a complete performance management system for facility operations. 🌟


Reviews
There are no reviews yet.