Managing facility services today is not just about fixing issues—it is about visibility, control, and continuous improvement. The Facility Services Dashboard in Excel is a powerful, ready-to-use solution designed to help facility managers and operations teams track performance, control costs, meet SLAs, and improve service quality using one familiar tool: Microsoft Excel.
This professionally designed dashboard converts raw facility service data into clear, interactive, and actionable insights. Instead of juggling multiple spreadsheets, emails, and reports, you get a single centralized dashboard that shows exactly how your facility services are performing—across facilities, service types, regions, and time.
🚀 Key Features of Facility Services Dashboard in Excel
✅ Centralized Facility Performance Monitoring
Track all key facility service KPIs such as delay %, completion hours, service cost, and priority services in one place.
📌 Interactive Slicers & Filters
Analyze data dynamically by service type, region, facility type, or month with instant visual updates.
📈 Multi-Level Analysis Pages
Dive deep into performance using Facility Type, Service Type, Region, and Month-wise analysis pages.
⏱️ SLA & Delay Tracking
Quickly identify SLA breaches and delayed services to take corrective actions.
💰 Service Cost Visibility
Understand where money is being spent and which services or regions drive higher costs.
🧭 Easy Page Navigation
Use the built-in page navigator to move seamlessly between analytical views.
📊 Professional Charts & KPI Cards
Clean visuals designed for management reviews and decision-making.
📂 What’s Inside the Facility Services Dashboard in Excel
This ready-to-use Excel file includes:
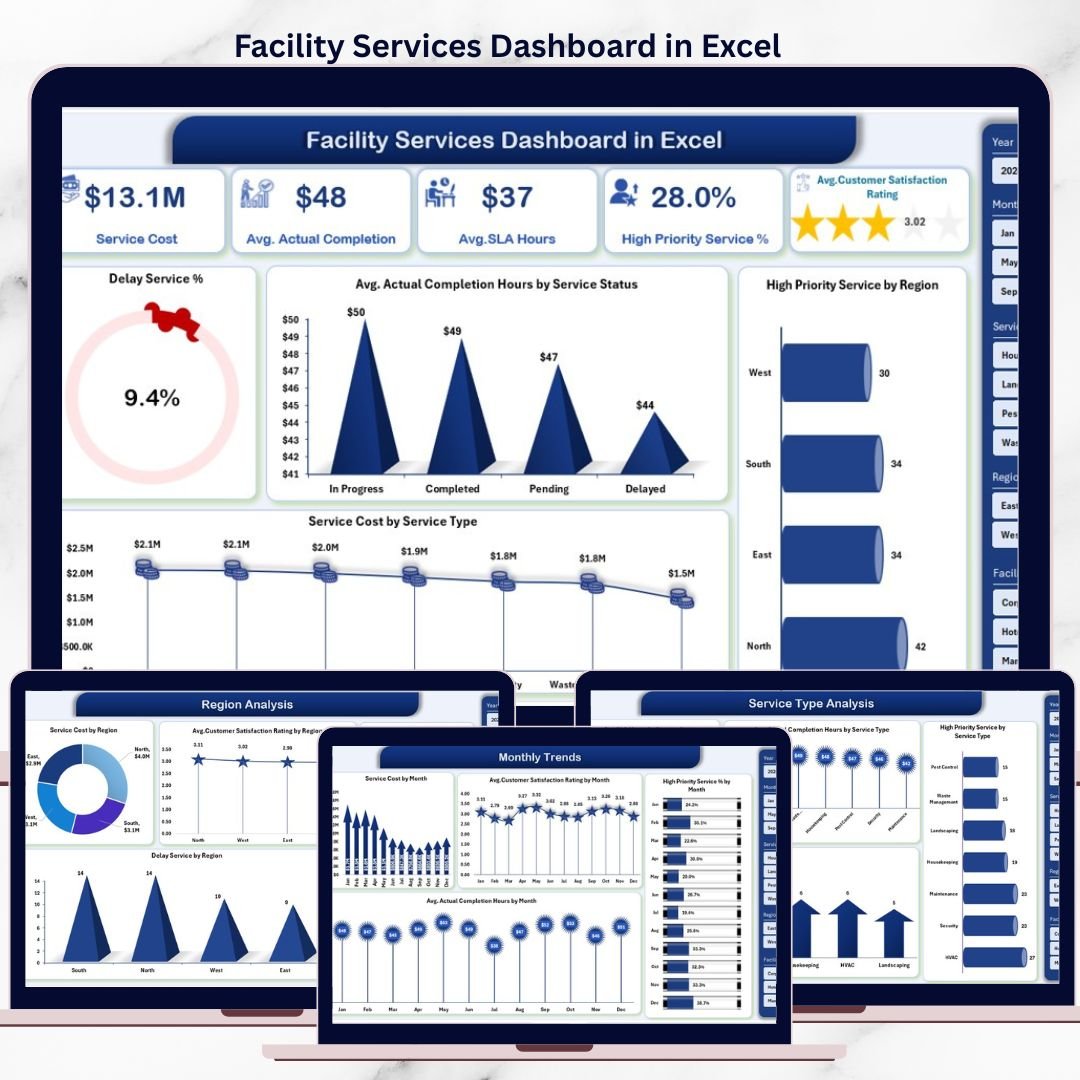
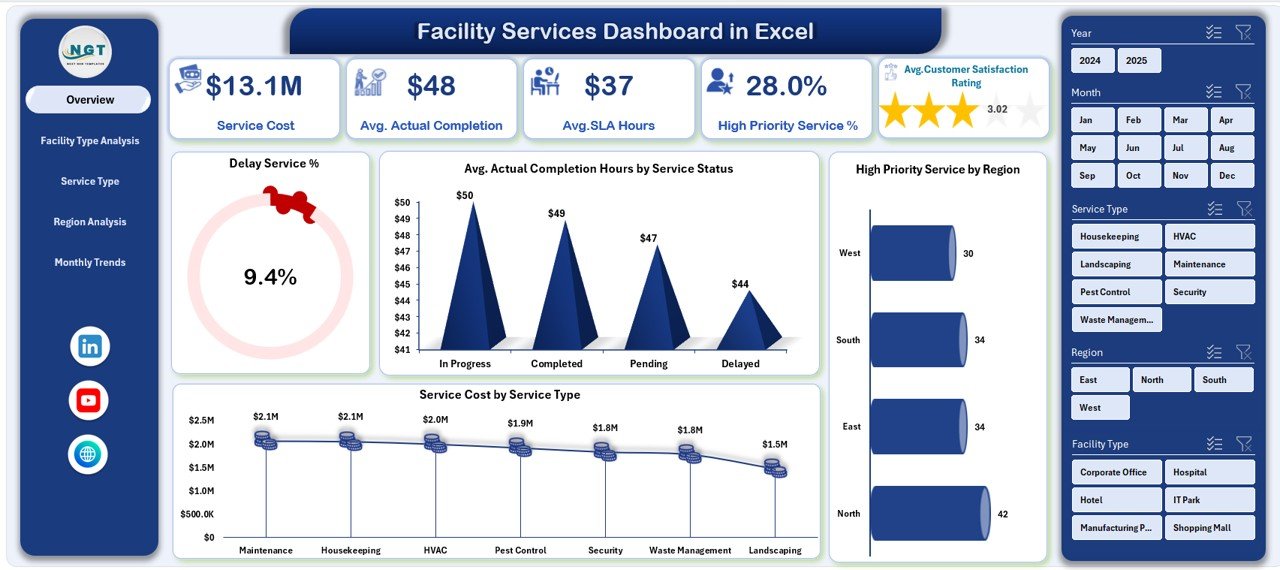
📄 Overview Dashboard Page
• Delay Service %
• Average Actual Completion Hours
• High Priority Service Count
• Total Service Cost
• Supporting charts for cost, delays, and regional performance
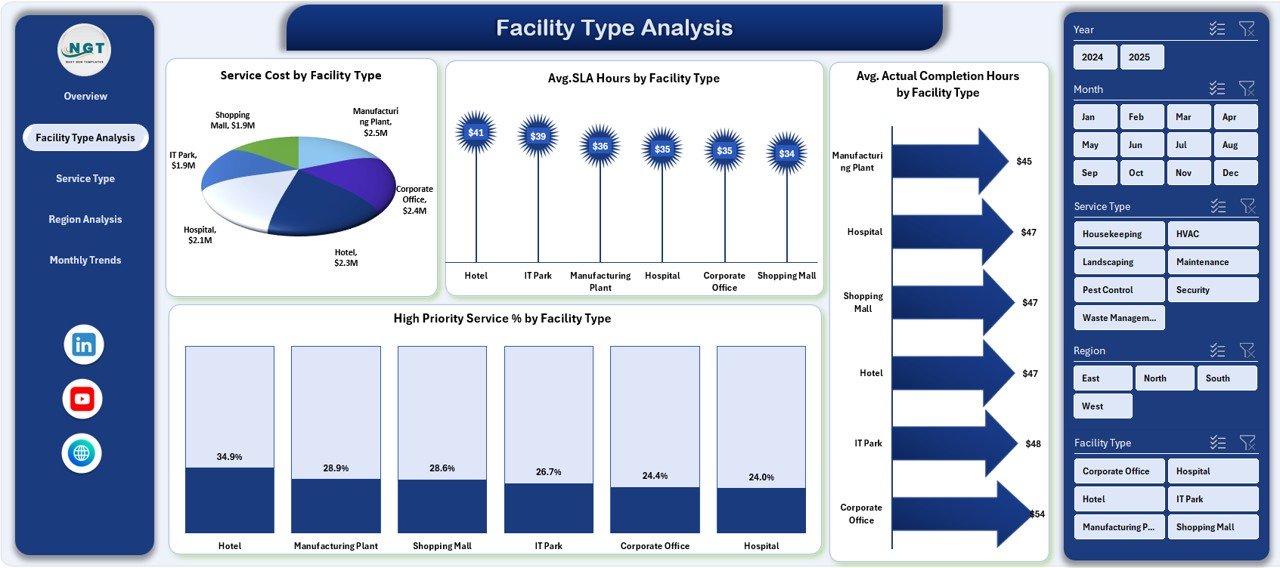
🏢 Facility Type Analysis Page
• Service Cost by Facility Type
• Average SLA vs Actual Completion Hours
• High Priority Service % by Facility Type
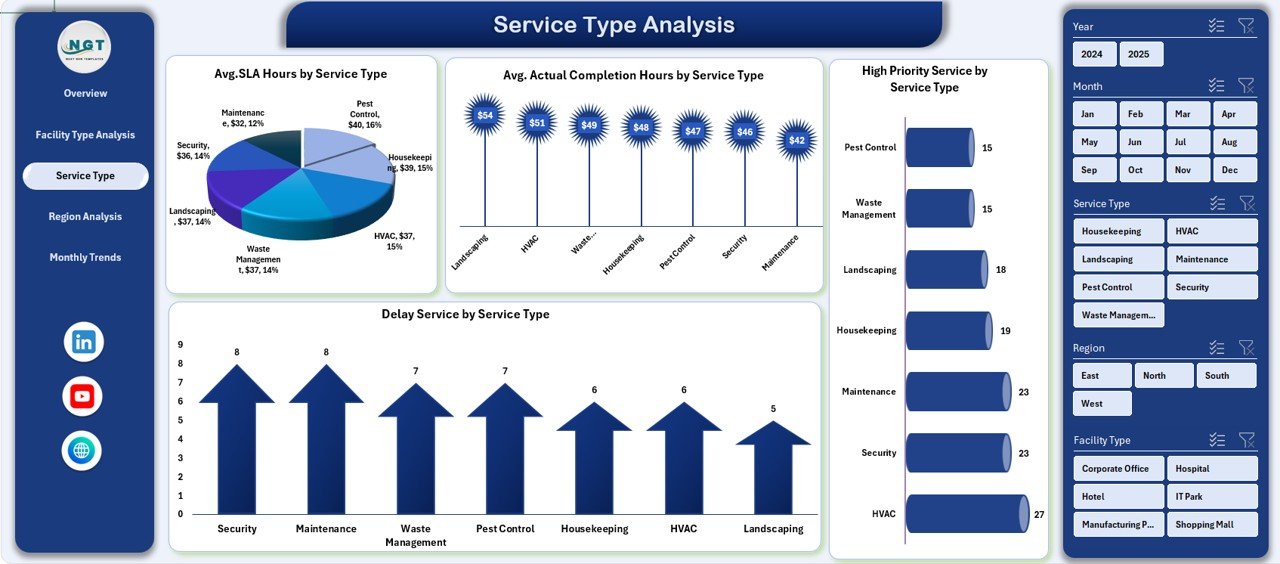
🛠️ Service Type Analysis Page
• SLA & Completion Hours by Service Type
• Delay % and Priority Service Analysis
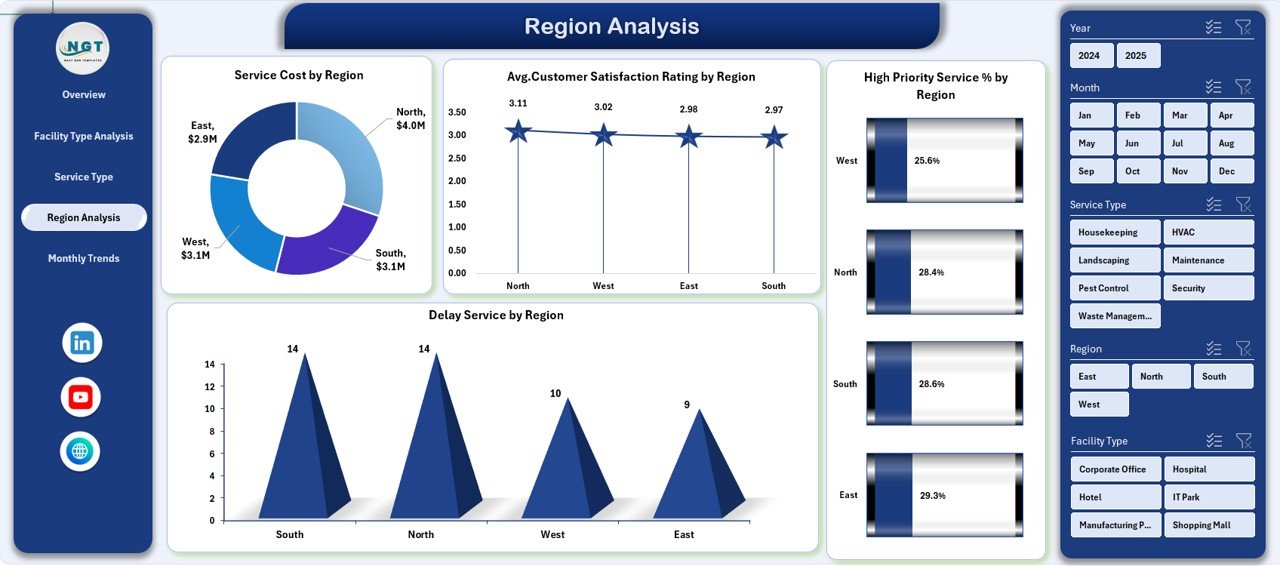
🌍 Region Analysis Page
• Service Cost by Region
• Customer Satisfaction Rating by Region
• Delay % and High Priority Service %
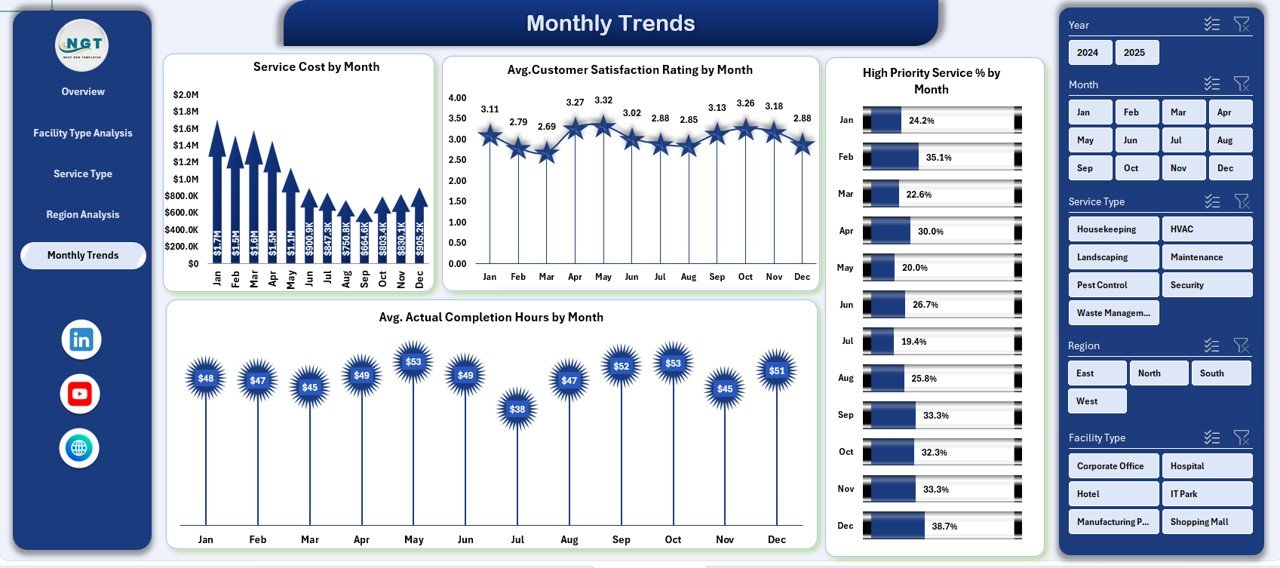
📆 Month Analysis Page
• Monthly Service Cost Trends
• Customer Satisfaction Trends
• Priority Services & Completion Hours Over Time
🗂️ Data Sheet – Structured raw facility service data
⚙️ Support Sheet – Dropdowns, slicers, and reference tables
🛠️ How to Use the Facility Services Dashboard in Excel
1️⃣ Enter or paste your facility service data into the Data Sheet
2️⃣ Update reference values in the Support Sheet if needed
3️⃣ Use slicers on the dashboard pages to filter by region, service type, or month
4️⃣ Review KPIs and charts to identify delays, cost issues, and performance gaps
5️⃣ Share insights with stakeholders for faster, data-driven decisions
No advanced Excel skills are required. If you can use Excel, you can use this dashboard.
👥 Who Can Benefit from This Facility Services Dashboard
🏢 Facility Managers
🧰 Maintenance & Operations Teams
📋 Service Coordinators
🌍 Regional & Area Managers
📊 Business Analysts
👔 Senior Leadership & Decision-Makers
This dashboard is ideal for organizations managing multiple facilities, vendors, and service types.
🔗 Click here to read the Detailed blog post
▶️ Visit our YouTube channel to learn step-by-step video tutorials
Visit our YouTube channel to learn step-by-step video tutorials


Reviews
There are no reviews yet.