Managing facilities without clear performance visibility leads to inefficiencies, rising costs, and reactive decision-making. Buildings generate massive operational data every month—but without the right dashboard, that data remains unused.
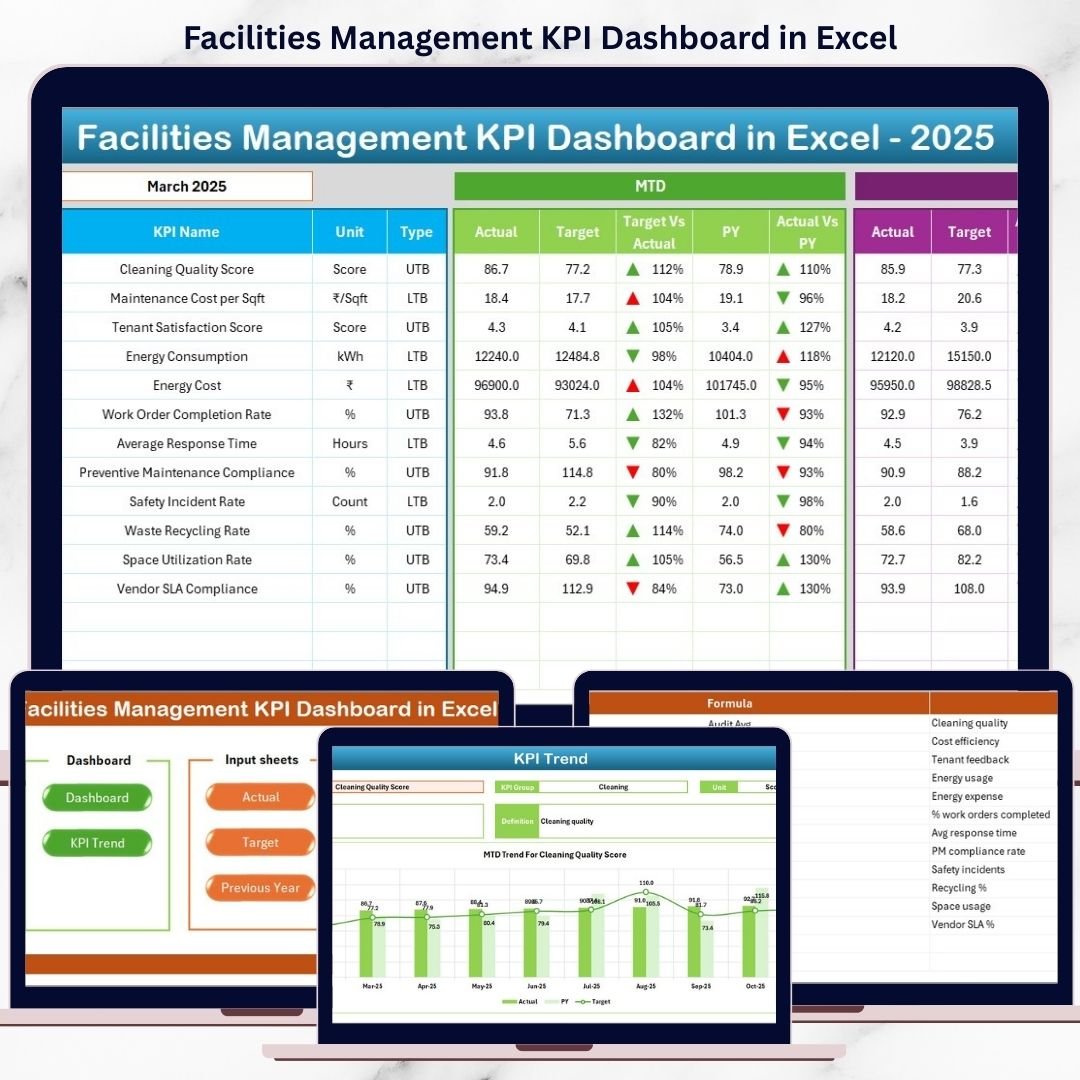
The Facilities Management KPI Dashboard in Excel is a ready-to-use, interactive, and business-ready solution designed to transform raw facility data into clear insights, trends, and actionable decisions—all inside Excel.
This dashboard is built for real-world facility operations, allowing managers to monitor maintenance, utilities, safety, assets, and service quality from one centralized file. No complex software. No heavy learning curve. Just smart reporting.
🚀 Key Features of Facilities Management KPI Dashboard in Excel
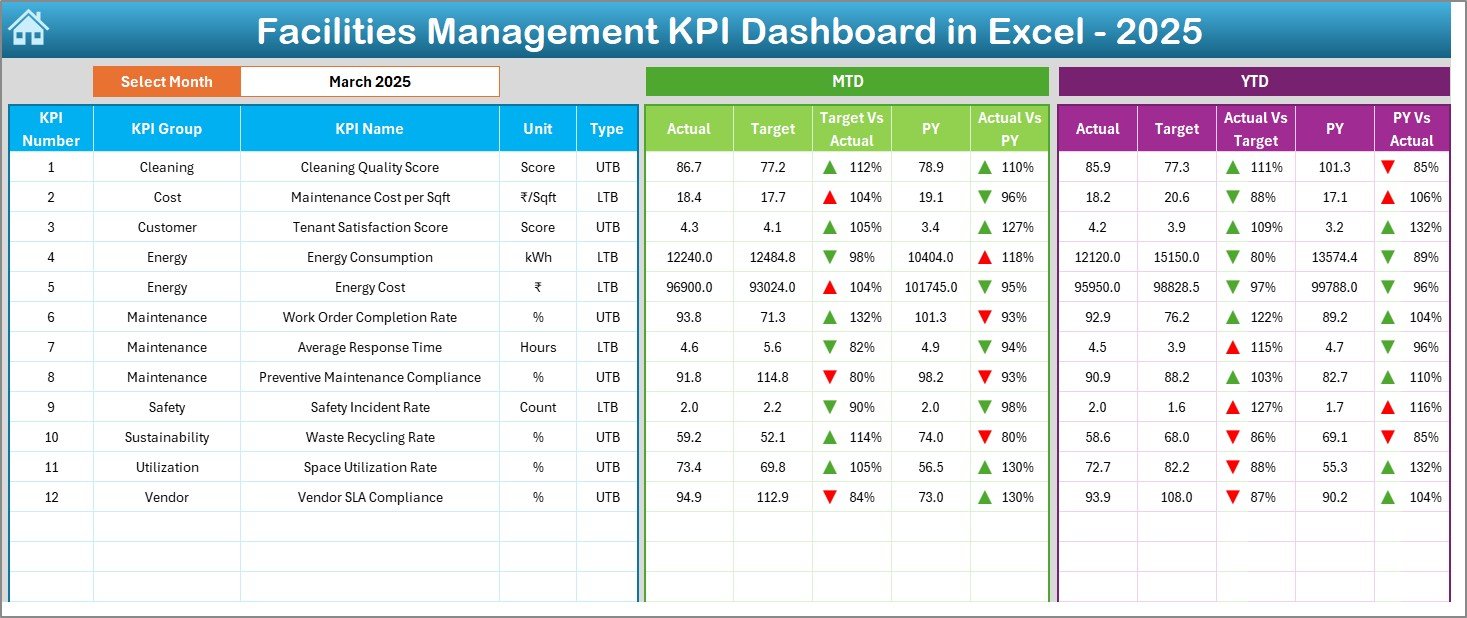
✅ Interactive Month Selector – Instantly analyze performance by selecting the month from a dropdown
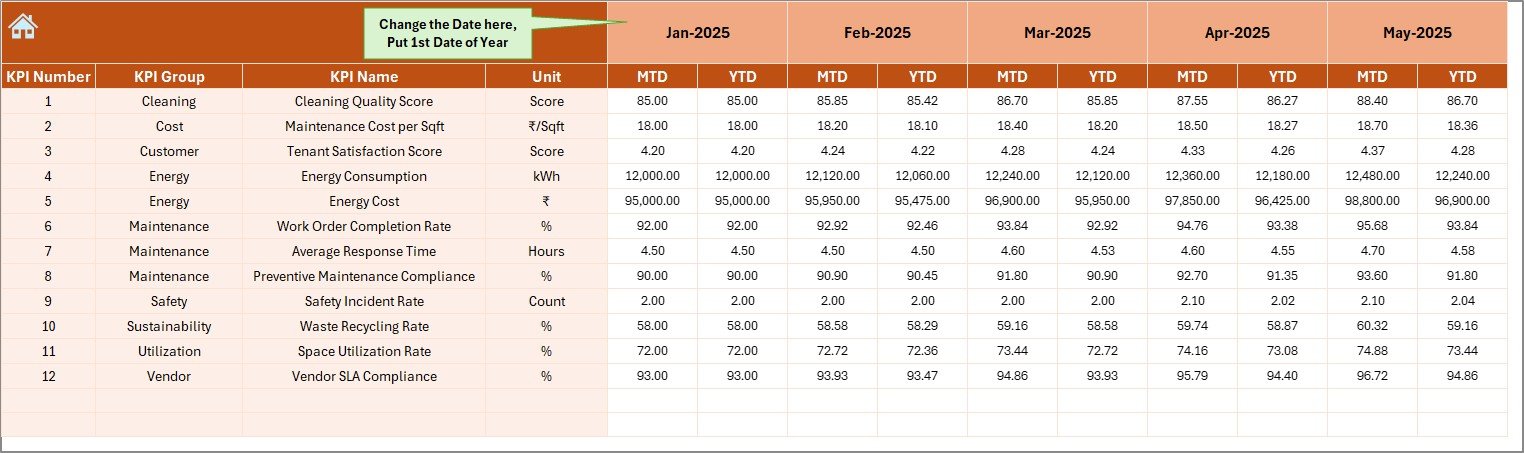
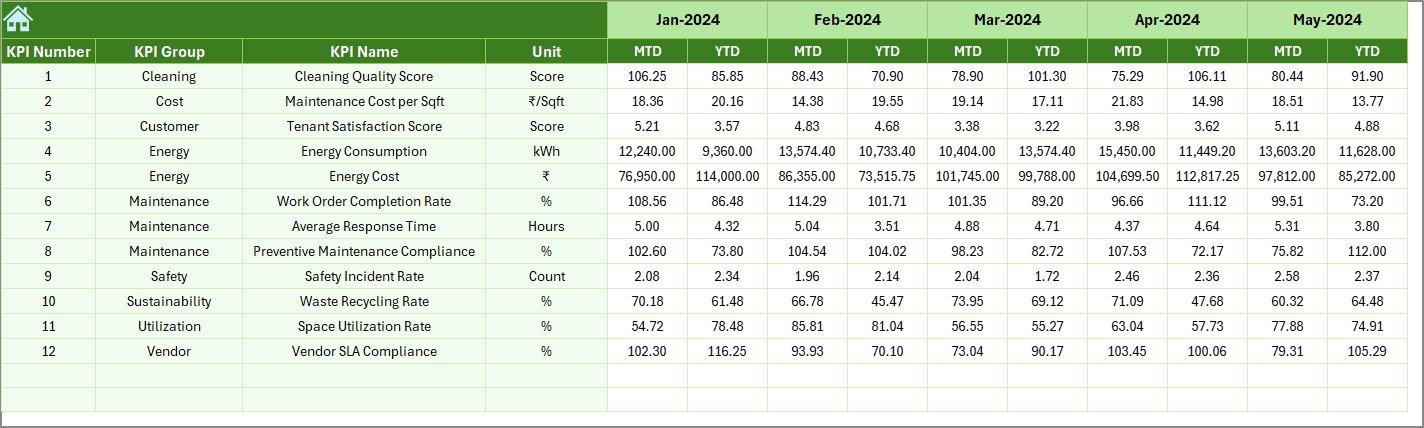
✅ MTD & YTD Analysis – Track short-term performance and long-term progress together
✅ Target vs Actual Comparison – Instantly identify gaps using visual indicators
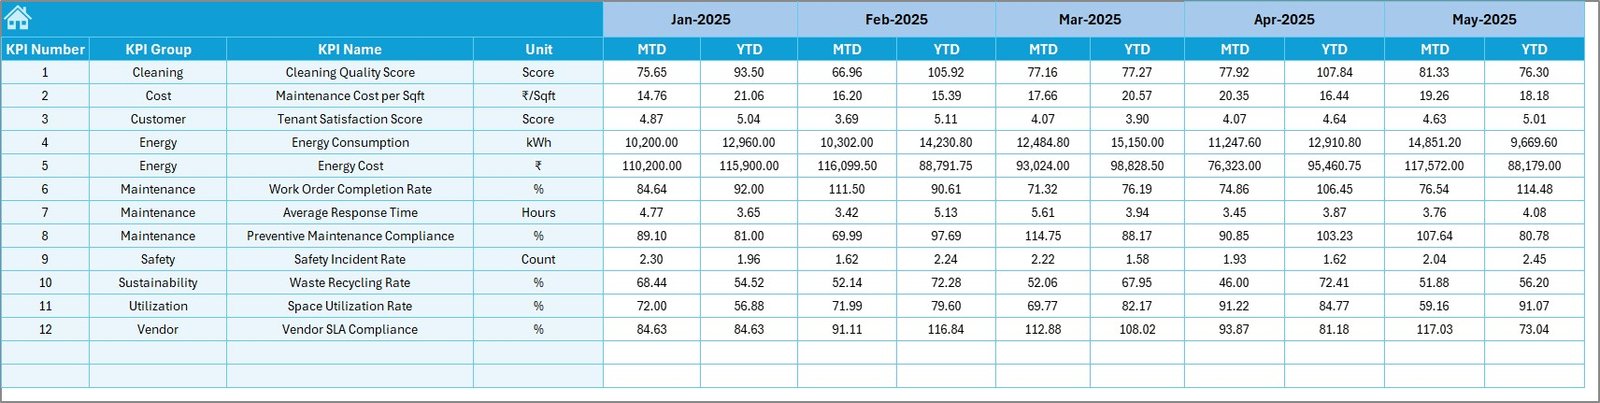
✅ Previous Year Benchmarking – Measure improvement or decline year-over-year
✅ Conditional Formatting Arrows – Quickly spot performance wins and risks
✅ Trend Analysis by KPI – Understand patterns instead of static numbers
✅ Centralized KPI Definitions – Ensure clarity and consistency across teams
✅ Excel-Based & Customizable – Modify KPIs, targets, and formulas easily
This dashboard helps you move from manual reporting to proactive facility management.
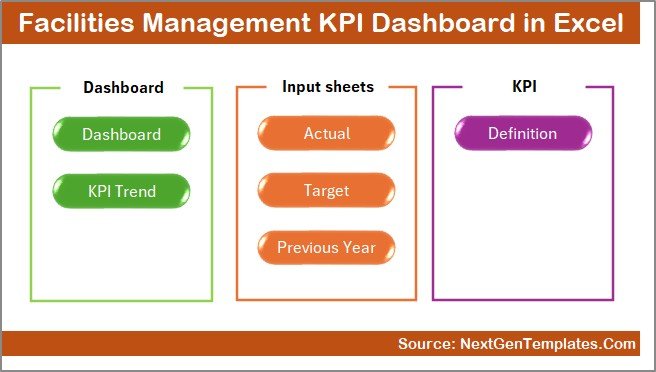
📁 What’s Inside the Facilities Management KPI Dashboard
This dashboard contains 7 professionally structured worksheets, each designed for a specific purpose:
📌 Summary Page
A clean index page with navigation buttons to access all dashboard sections instantly.
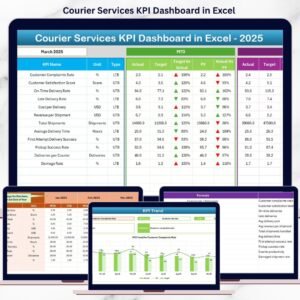
📌 Dashboard Sheet
The main performance view showing:
-
MTD Actual, Target, and Previous Year
-
YTD Actual, Target, and Previous Year
-
Visual variance indicators with arrows
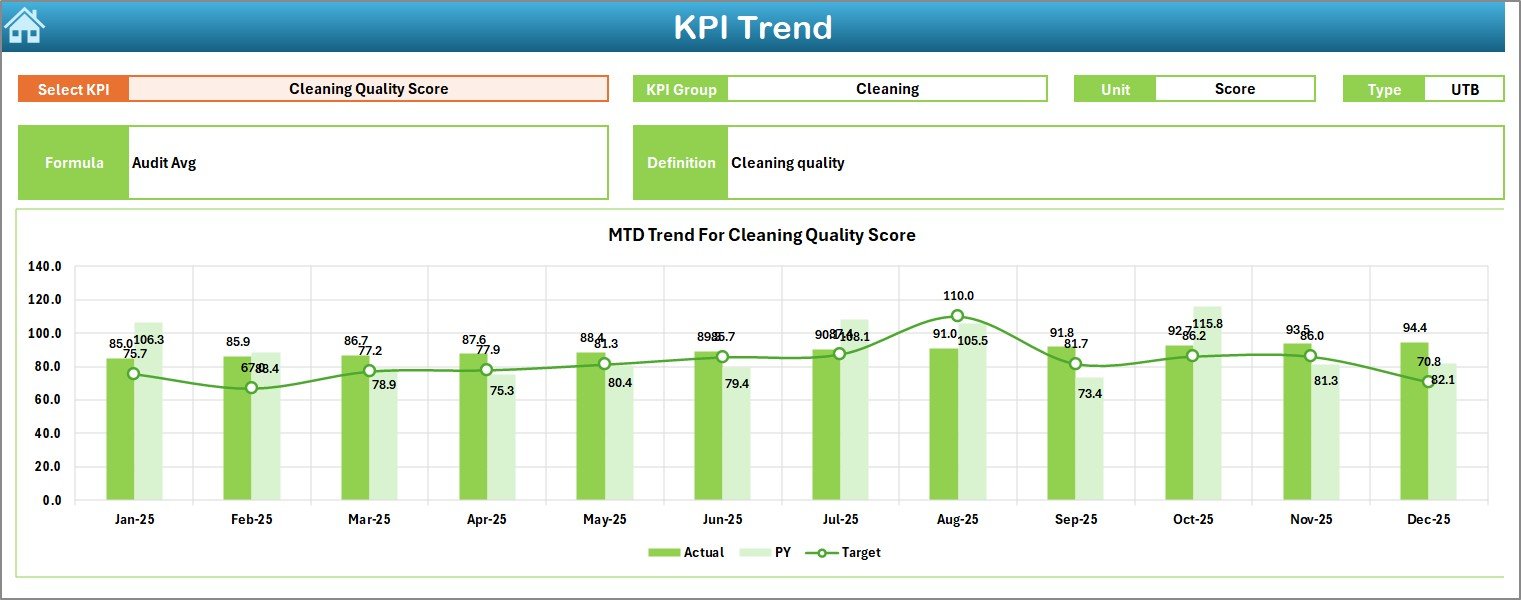
📌 Trend Sheet
Deep-dive analysis of individual KPIs with:
-
KPI Group, Unit, and Type
-
KPI Formula & Definition
-
MTD and YTD trend charts
📌 Actual Numbers Input Sheet
Enter real performance data with controlled inputs to reduce errors.
📌 Target Sheet
Define monthly and yearly performance benchmarks clearly.
📌 Previous Year Numbers Sheet
Store historical data for year-over-year comparison.
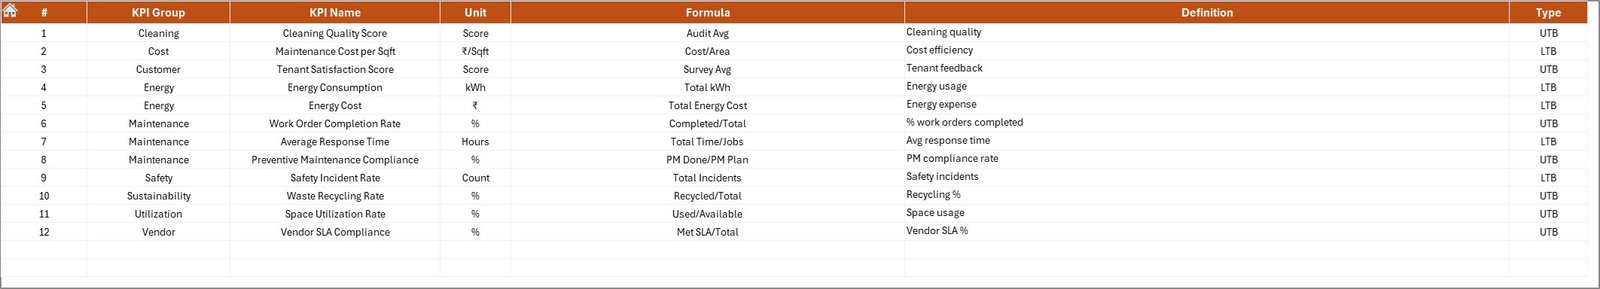
📌 KPI Definition Sheet
Maintain standardized KPI names, formulas, units, and definitions.
🛠️ How to Use the Facilities Management KPI Dashboard
Using this dashboard is simple—even for Excel beginners:
1️⃣ Enter KPI definitions once
2️⃣ Input monthly actual values
3️⃣ Set realistic targets
4️⃣ Select the month from the dropdown
5️⃣ Instantly review performance, gaps, and trends
All calculations and visuals update automatically, saving hours of manual work every month.
👥 Who Can Benefit from This Facilities Management KPI Dashboard?
This dashboard is ideal for:
🏢 Facility Managers – Monitor operations and maintenance efficiency
🏭 Operations Managers – Improve asset utilization and cost control
🛠️ Maintenance Teams – Track response times and downtime trends
🏬 Property Managers – Improve service quality across buildings
📊 Corporate Admin Teams – Enable data-driven facility decisions
If you manage offices, hospitals, campuses, factories, malls, or commercial buildings, this dashboard fits perfectly.
Click here to read the Detailed Blog Post
Watch the step-by-step video tutorial:
Visit our YouTube channel to learn step-by-step video tutorials:
🔗 https://www.youtube.com/@PKAnExcelExpert


Reviews
There are no reviews yet.