Managing facilities is no small task—every request, maintenance issue, and location-specific challenge adds to the workload. Without a proper system, it’s easy to miss deadlines, overload departments, or let high-priority issues slip through the cracks. That’s why we created the Facilities Management Dashboard in Excel—a powerful, ready-to-use tool designed to streamline facility operations, improve accountability, and reduce inefficiencies.
Built with Excel’s interactive features like slicers, navigation buttons, KPI cards, and charts, this dashboard centralizes all facility-related data into one clear view. No more scattered spreadsheets or manual reports—just instant insights at your fingertips.
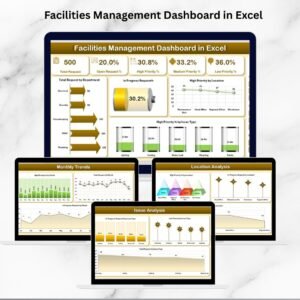
✨ Key Features of Facilities Management Dashboard in Excel
-
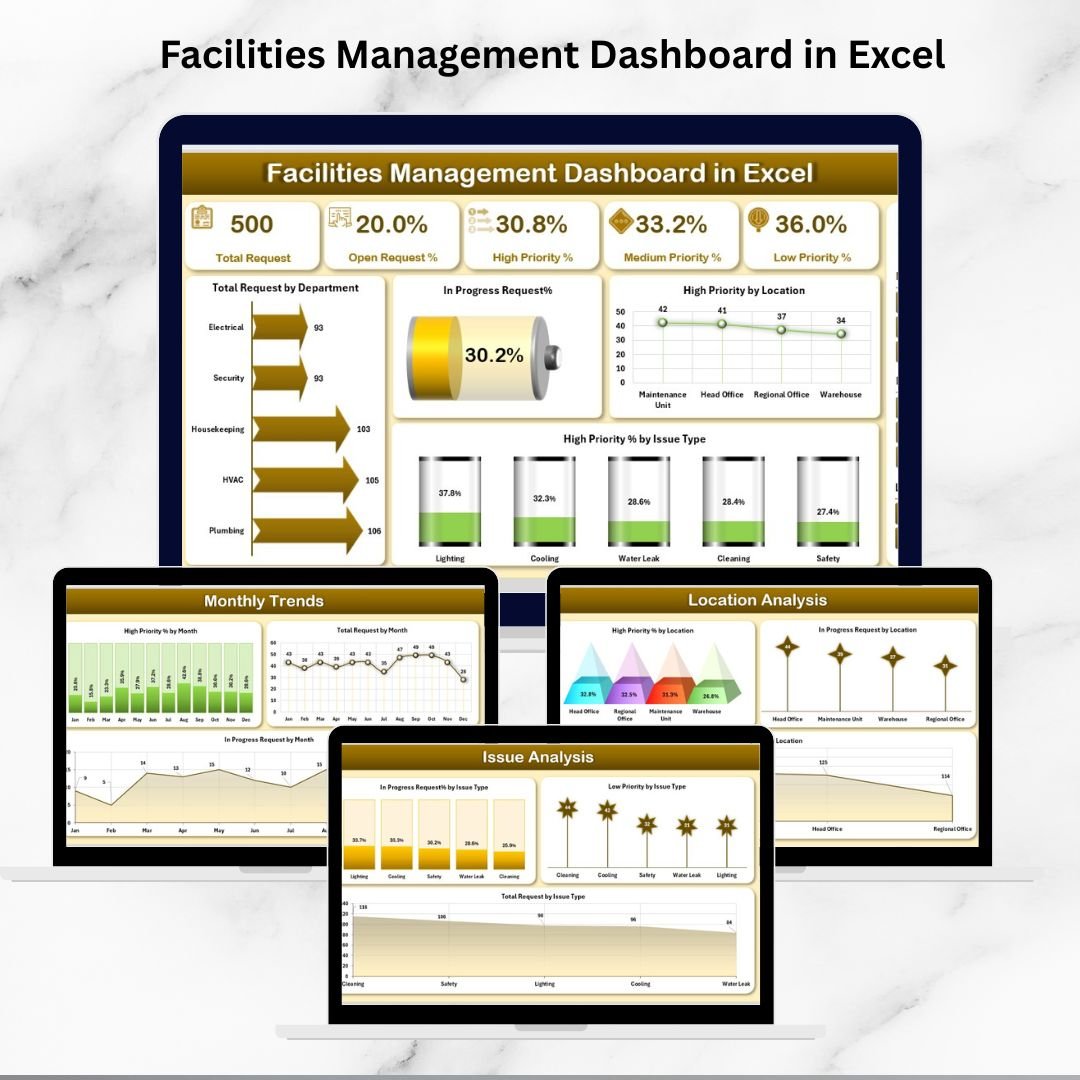
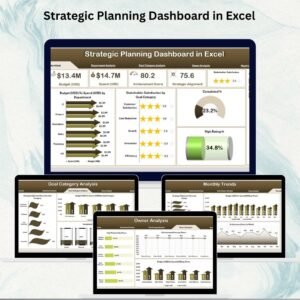
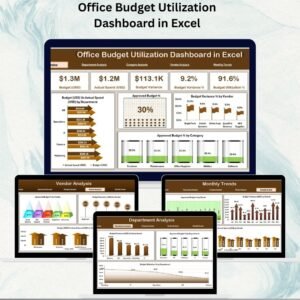
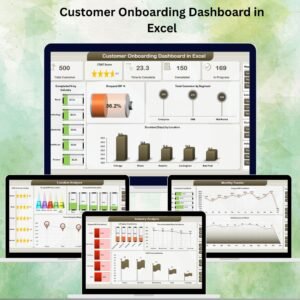
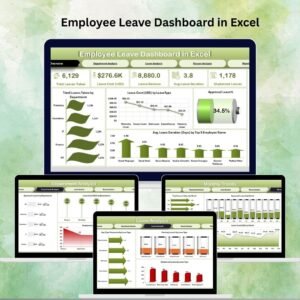
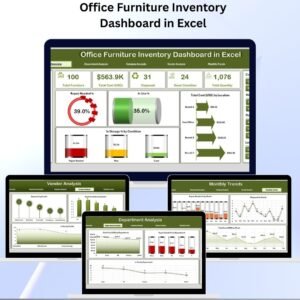
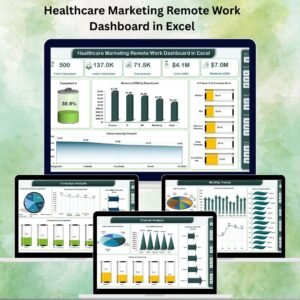
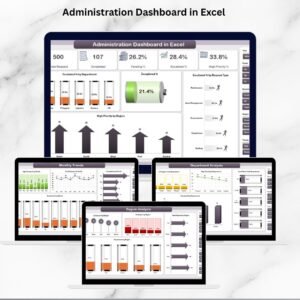
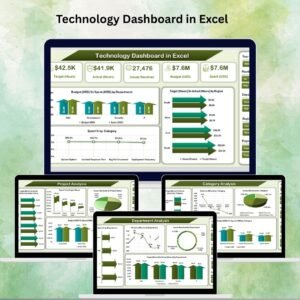
📊 5 Analytical Pages – Overview, Department Analysis, Issue Analysis, Location Analysis, and Monthly Trends.
-
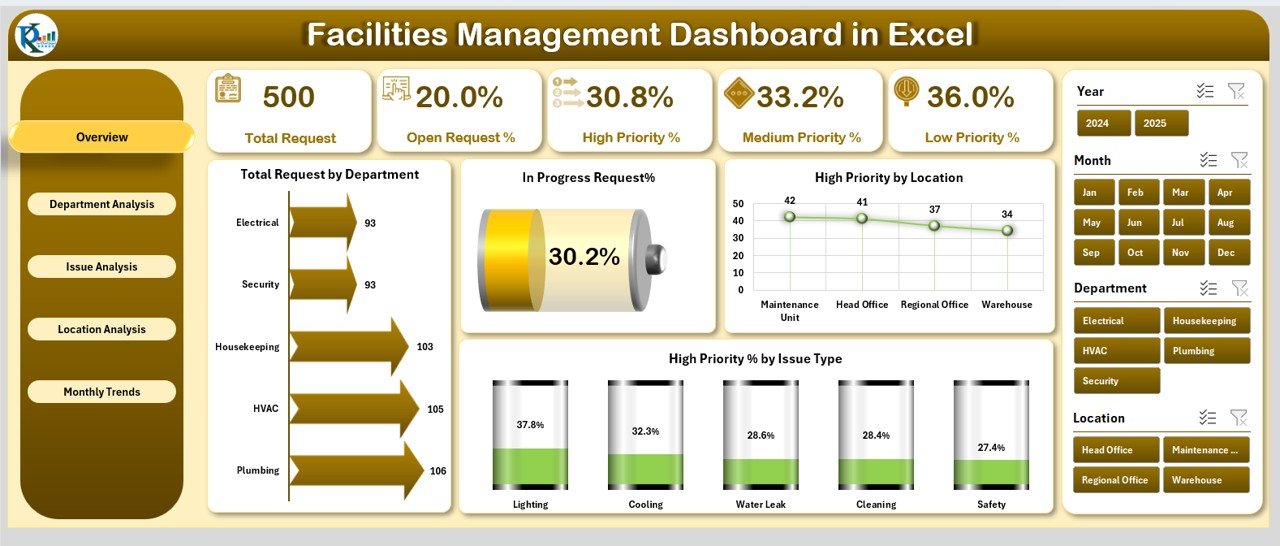
🎯 KPI Cards & Charts – Quickly see total requests, completed requests, escalated % and high-priority tasks.
-
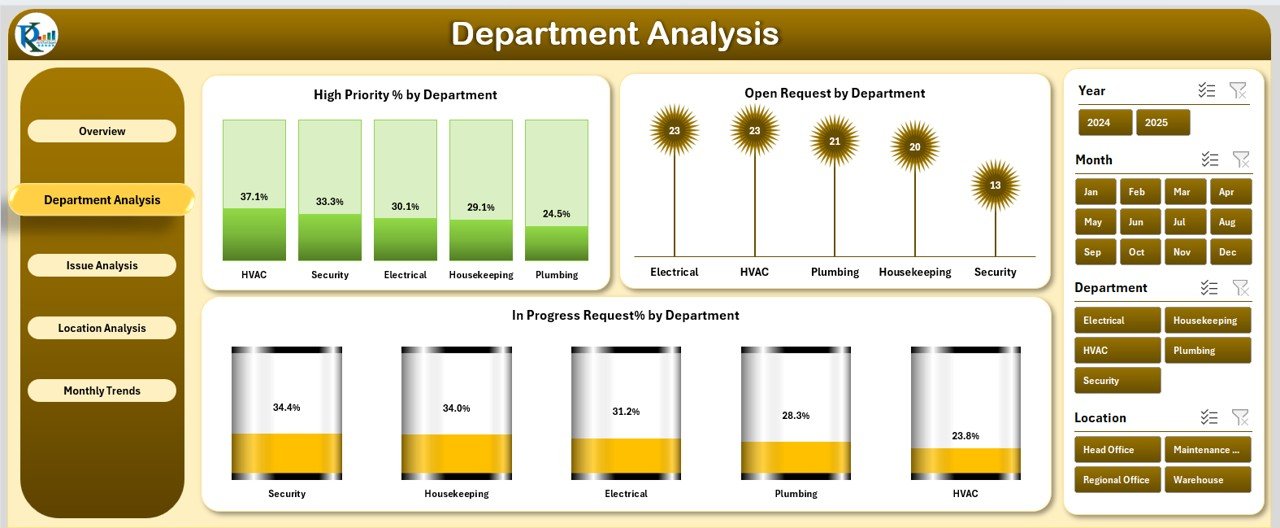
⚡ Department-Level Breakdown – Identify bottlenecks with in-progress % and high-priority loads.
-
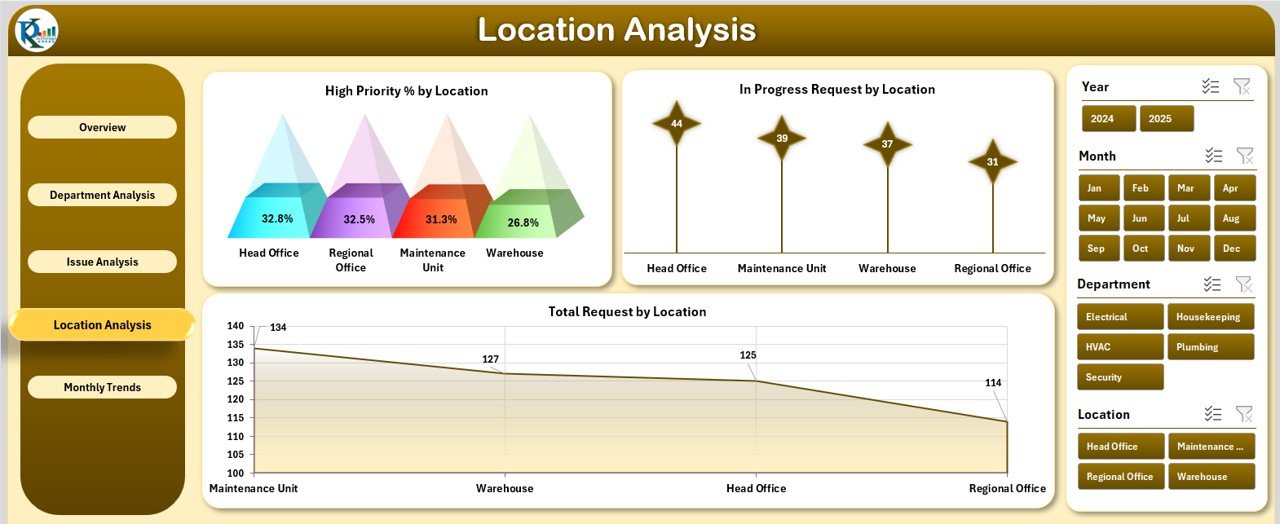
📍 Location Insights – Track requests and issues by region, branch, or facility.
-
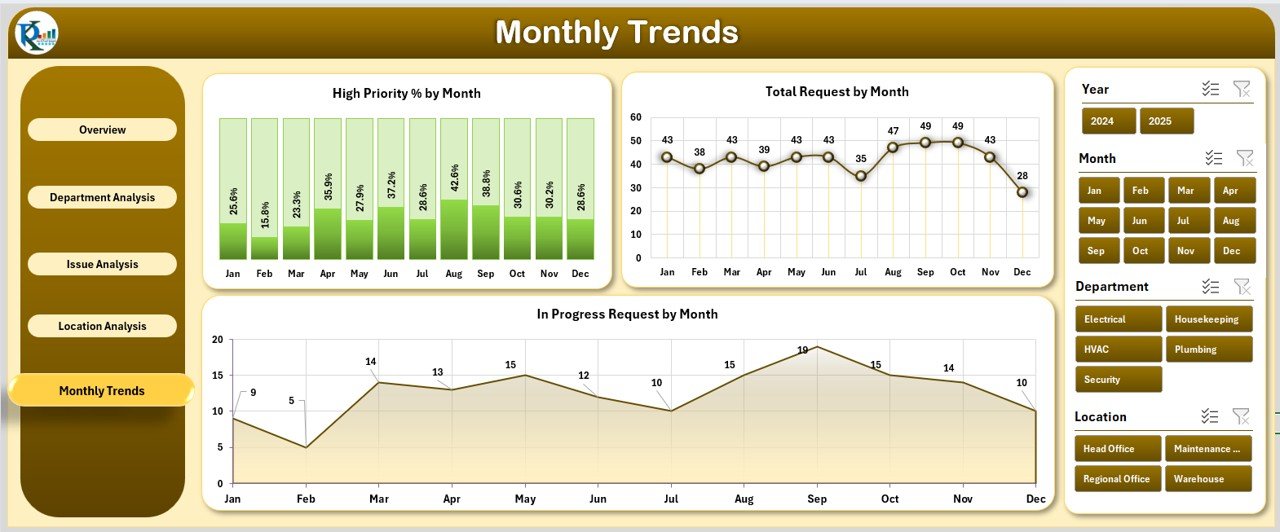
📈 Monthly Trends – Detect seasonal patterns and forecast workloads with trend charts.
-
🗂 Support Sheet – Organized backend for storing requests, ensuring data consistency.
-
🛠 Customizable – Add departments, issue types, or KPIs as per your needs.
-
💰 Cost-Effective – No additional software required—Excel does it all.
📂 What’s Inside the Facilities Management Dashboard
-
Overview Page – A summary with cards and 4 charts to get a snapshot of current performance.
-
Department Analysis – Compare how different departments manage requests with detailed charts.
-
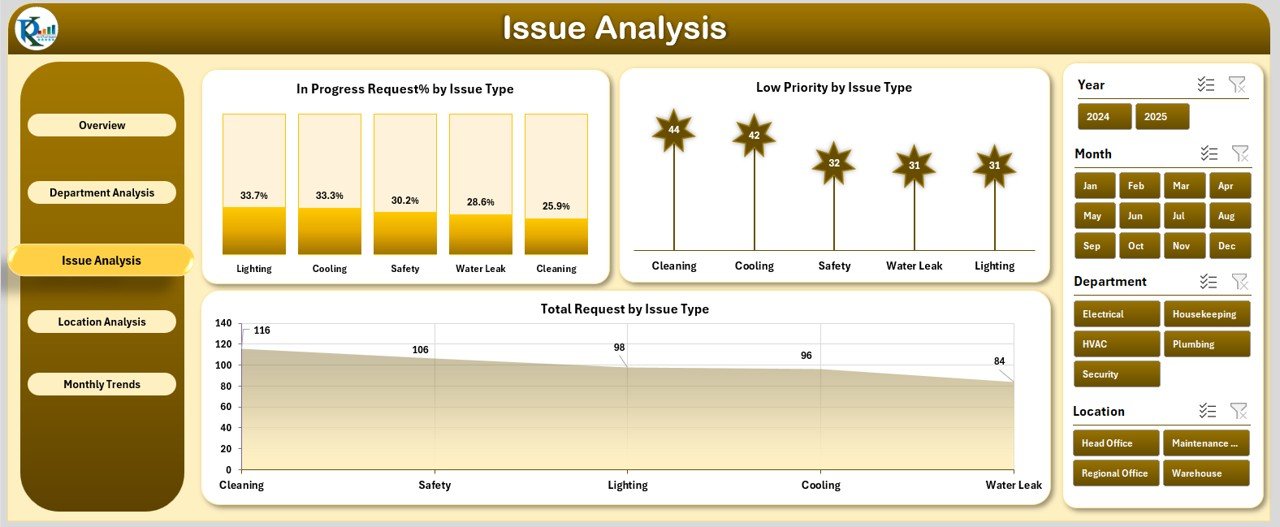
Issue Analysis – Focus on recurring issues and request types for smarter planning.
-
Location Analysis – Track requests, escalations, and in-progress work across facilities.
-
Monthly Trends – Analyze performance over time to detect recurring challenges.
-
Support Sheet – The data hub powering all pages.
📖 How to Use the Facilities Management Dashboard
-
Input Data – Record requests, issue types, departments, and dates in the Support Sheet.
-
Navigate Pages – Use the Page Navigator to switch between Overview, Department, Issue, Location, and Trends.
-
Analyze Performance – Review KPI cards, charts, and drill down into departments or locations.
-
Take Action – Prioritize high-priority issues and allocate resources effectively.
-
Update Regularly – Refresh data daily or weekly for accurate reporting.
👥 Who Can Benefit from This Dashboard?
-
🏢 Corporate Offices – Track maintenance, HR, or IT facility requests.
-
🎓 Educational Institutions – Manage classroom, lab, or facility issues.
-
🏥 Healthcare Facilities – Ensure smooth operations across hospitals and clinics.
-
🏭 Manufacturing Plants – Monitor equipment and safety-related requests.
-
🌍 Non-Profits & NGOs – Handle administrative and operational facility requests.
If your organization deals with facility requests daily, this dashboard ensures nothing gets missed.


Reviews
There are no reviews yet.