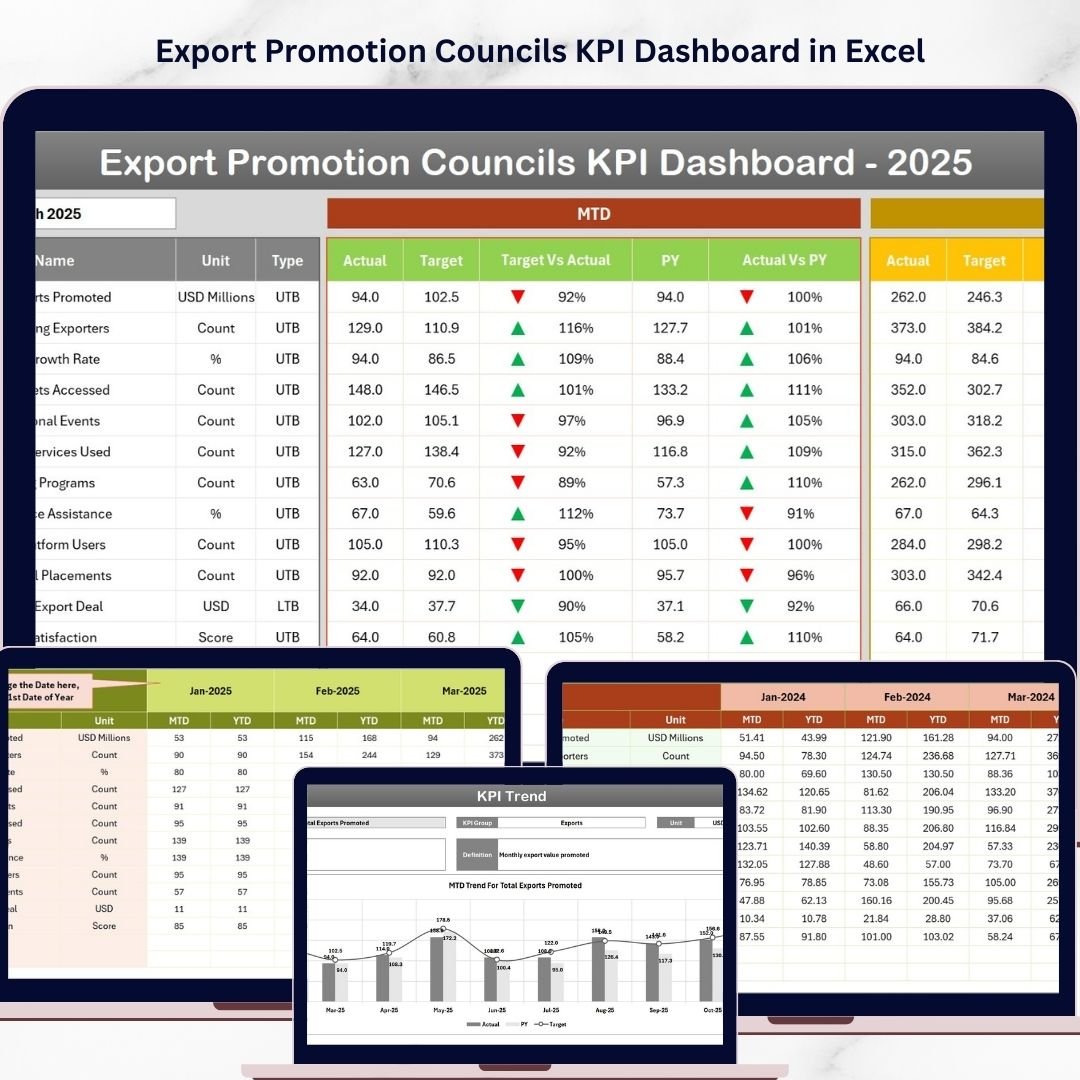
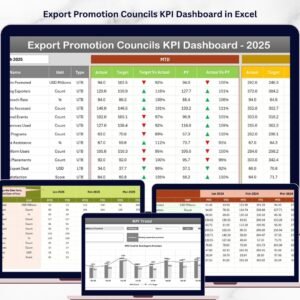
Key Features of Export Promotion Councils KPI Dashboard
The Export Promotion Councils KPI Dashboard is a comprehensive, dynamic digital tool designed to help export promotion councils and related organizations monitor, analyze, and improve their key performance indicators (KPIs) with ease. This dashboard consolidates critical data into visually intuitive sheets, empowering decision-makers to track monthly and yearly progress, compare targets versus actuals, and analyze trends effectively.
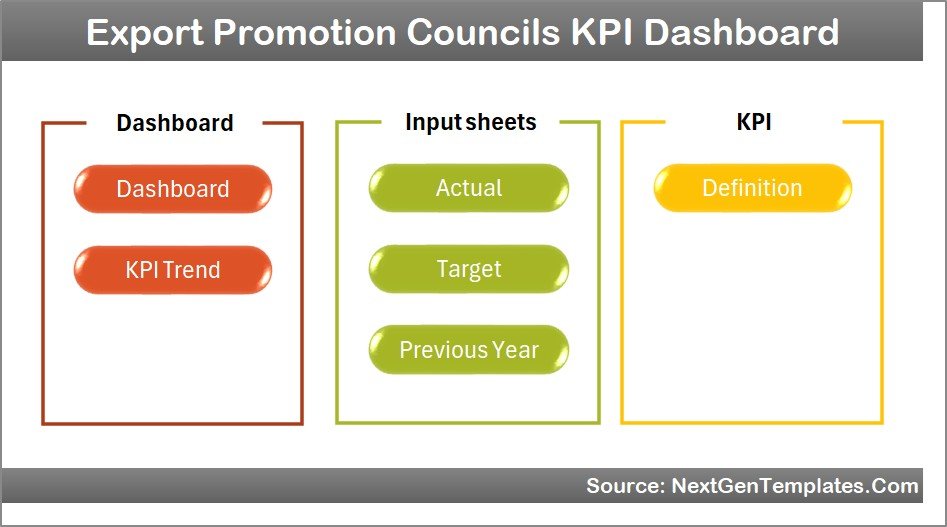
Featuring 7 well-structured worksheets, the dashboard offers a seamless navigation experience. The Home Sheet acts as a centralized index with 6 buttons, allowing instant access to respective sheets, streamlining your workflow.
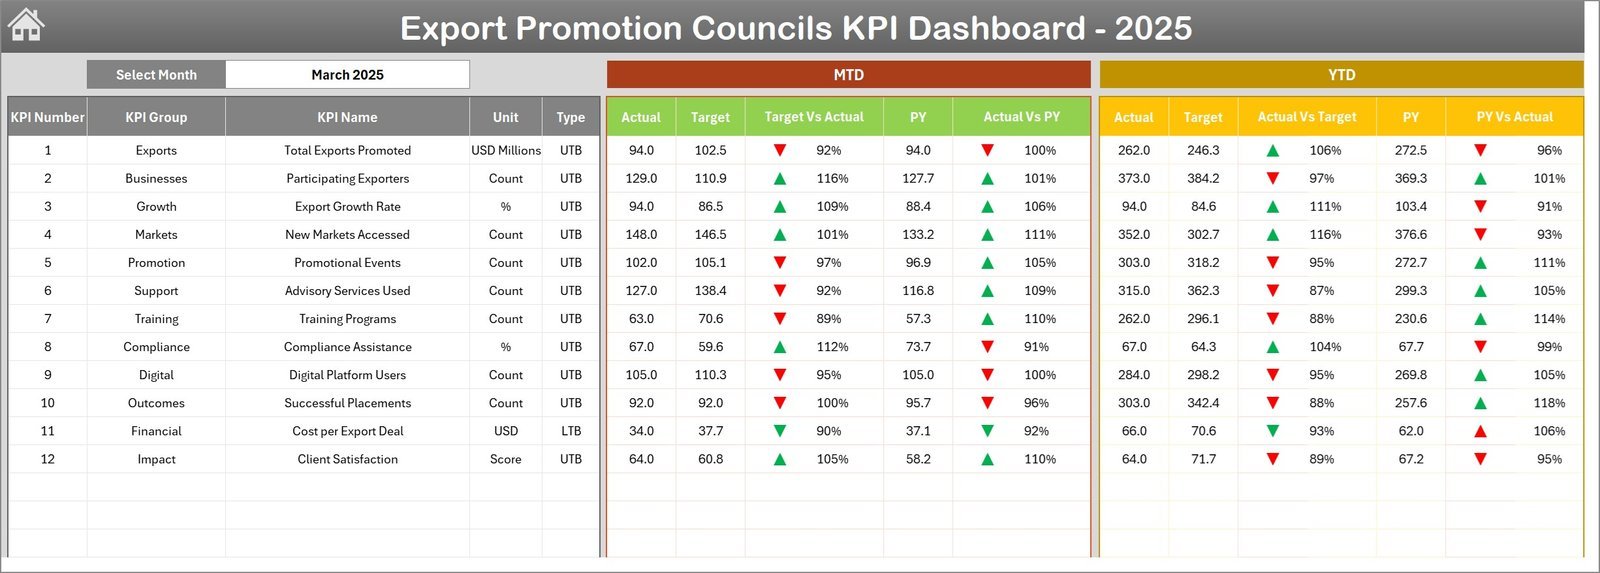
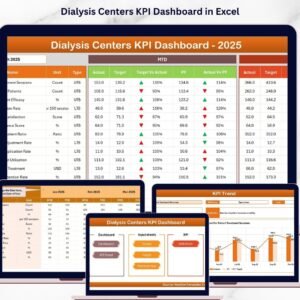
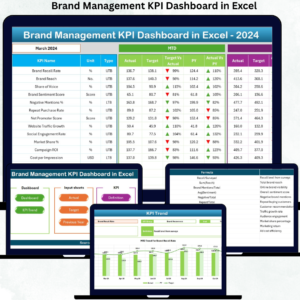
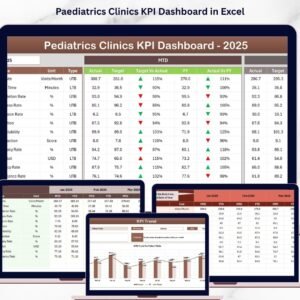
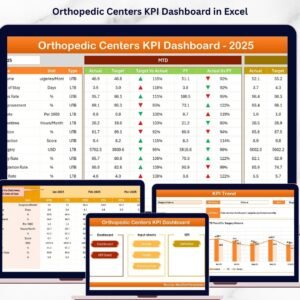
The Dashboard Sheet is the heart of the tool, providing detailed insights into all KPIs. Users can select any month from a drop-down menu, instantly updating all metrics including Month-to-Date (MTD) Actual, Target, Previous Year data, and Year-to-Date (YTD) values. Conditional formatting with up/down arrows visually highlights performance against targets and previous year benchmarks.
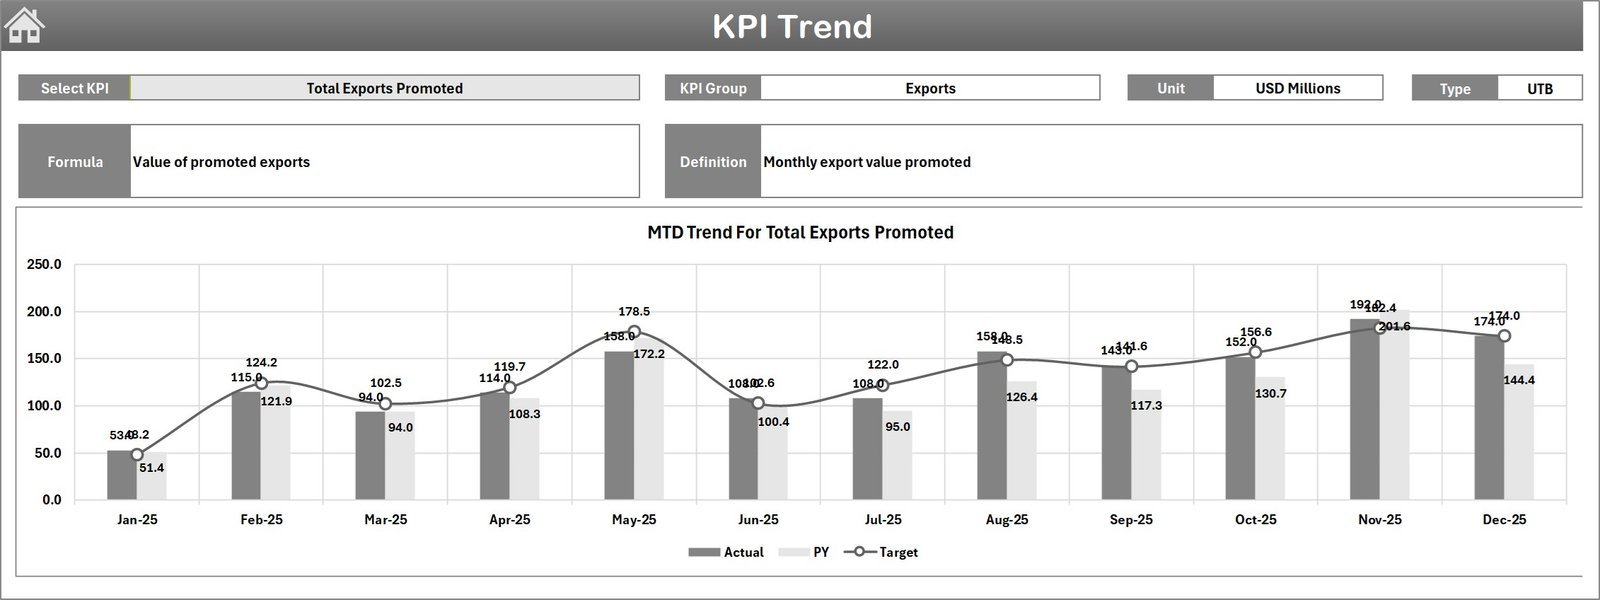
The KPI Trend Sheet allows deep dive analyses for individual KPIs. Select a KPI from the drop-down to view its group, unit, type (whether lower or upper the better), formula, and definition. Visual trend charts for MTD and YTD Actual, Target, and Previous Year data make it easy to identify growth patterns or areas of concern.
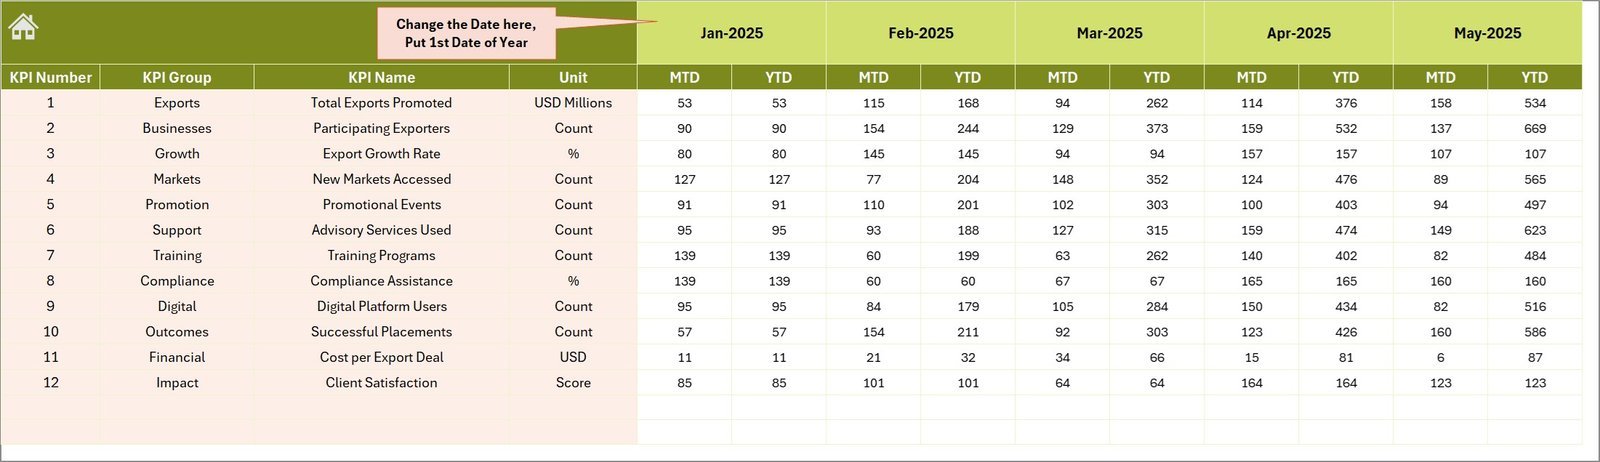
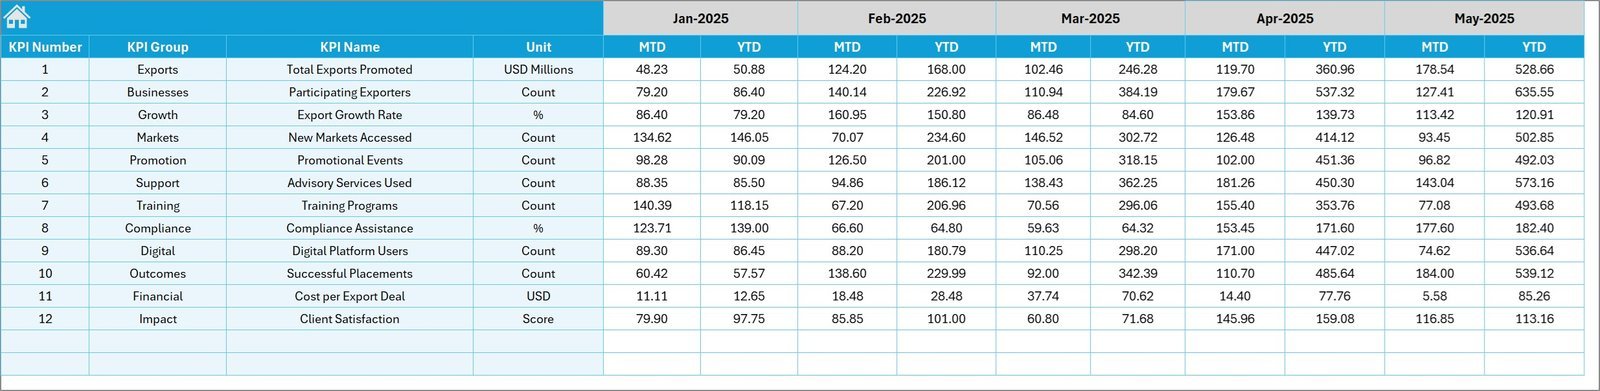
The dashboard also includes dedicated input sheets for Actual Numbers, Target Numbers, and Previous Year Numbers, ensuring data entry is straightforward and well-organized. Simply enter monthly values, and the dashboard updates automatically.
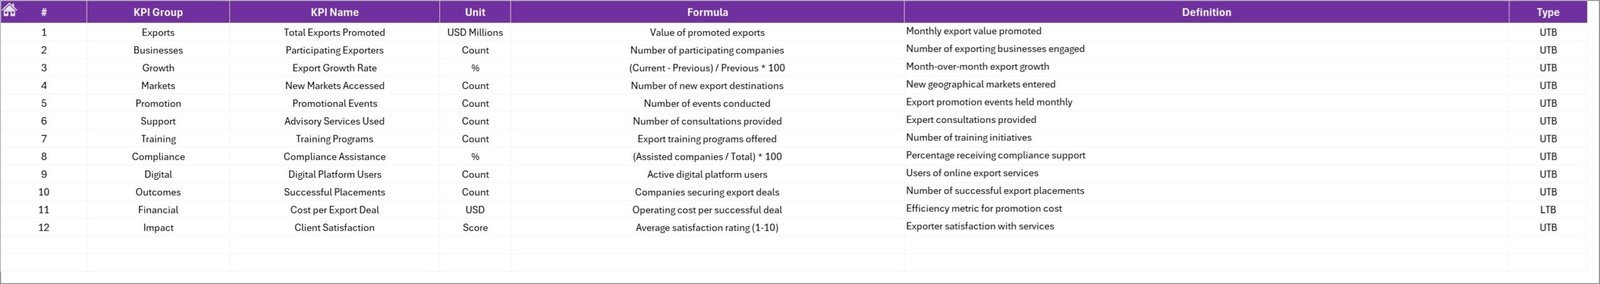
Finally, the KPI Definition Sheet offers complete clarity on each KPI, including its name, group, unit of measurement, formula, detailed definition, and KPI type (Lower the Better – LTB or Upper the Better – UTB), making it a perfect reference to maintain consistency and accuracy across the board.
What’s Inside the Export Promotion Councils KPI Dashboard
- 🏠 Home Sheet: Central navigation hub with buttons linking to other sheets for quick access.
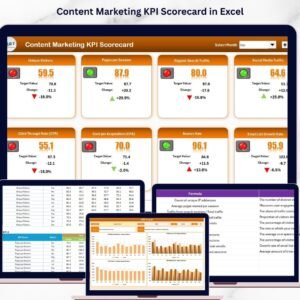
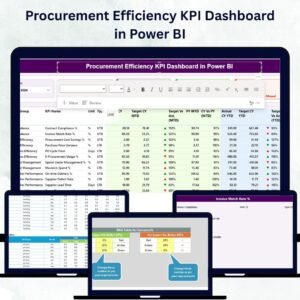
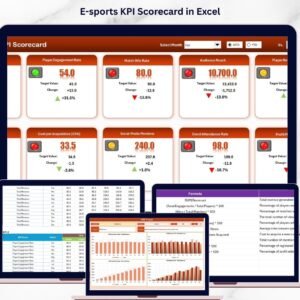
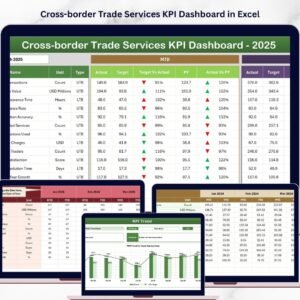
- 📊 Dashboard Sheet: Real-time KPI data visualization with dynamic month selection and conditional formatting.
- 📈 KPI Trend Sheet: In-depth trend analysis with charts and KPI details for better decision-making.
- 📝 Actual Numbers Input Sheet: Easy data entry for MTD and YTD actual performance figures.
- 🎯 Target Number Input Sheet: Enter MTD and YTD target values to measure progress against goals.
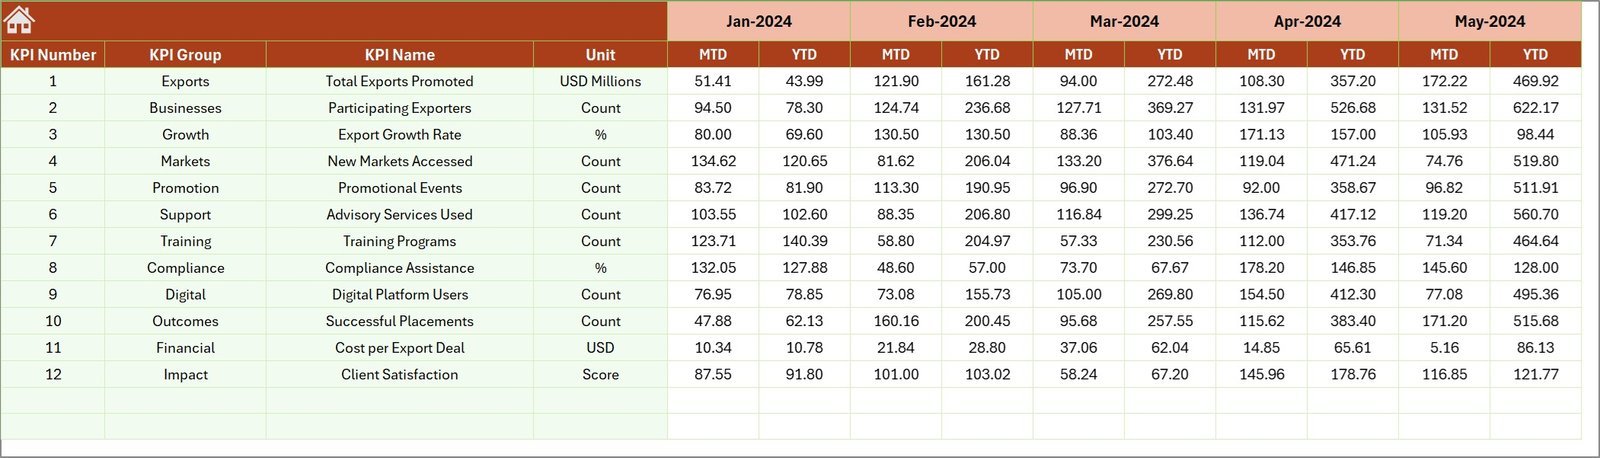
- 📅 Previous Year Number Sheet: Input previous year data for accurate year-over-year comparisons.
- 📚 KPI Definition Sheet: Comprehensive KPI glossary incorporating formulas, units, and performance types.
How to Use the Export Promotion Councils KPI Dashboard
Start by entering your baseline data in the Actual Numbers Input, Target Number Input, and Previous Year Number sheets. Input your first month of the year in the Actual Numbers Input sheet to set the timeline.
Navigate to the Dashboard Sheet and select the month you want to analyze from the drop–down menu. Watch as the dashboard dynamically updates to show MTD and YTD figures, comparing actuals against targets and previous year results. Use the up/down arrows to quickly identify where performance is exceeding expectations or falling short.
For a deeper dive, visit the KPI Trend Sheet. Select any KPI to examine its detailed metrics and visualize trends over time. This enables proactive management and quick corrective actions if needed.
Refer to the KPI Definition Sheet whenever you need clarity on KPI formulas, units, or whether a higher or lower value is desirable, ensuring consistent interpretation across your team.
This dashboard is designed with user-friendliness and flexibility in mind, making it easy for users with all levels of expertise to input data, analyze performance, and generate actionable insights.
Who Can Benefit from This Export Promotion Councils KPI Dashboard
- 🚀 Export Promotion Councils: To track and enhance export-related performance metrics efficiently.
- 📈 Business Analysts & Managers: For detailed KPI monitoring and trend analysis to drive strategic decisions.
- 💼 Government Trade Departments: To evaluate and promote export growth initiatives with clear data insights.
- 📊 Data-Driven Teams: Who require centralized KPI tracking with easy data input and visualization.
- 🏢 Trade Associations: To benchmark performance against targets and historical data.
- 🖥️ Consultants & Advisors: To provide clients with actionable export performance monitoring tools.
- 📑 Project Managers: To measure progress and ensure alignment with export promotion objectives.
- 🕒 Time-Conscious Professionals: Who want quick, accurate KPI insights without complex manual calculations.
Click here to read the Detailed blog post.
Visit our YouTube channel to learn step-by-step video tutorials


Reviews
There are no reviews yet.