Sustainability is no longer optional. Investors, regulators, customers, and employees now expect organizations to measure, track, and report ESG performance with transparency and accuracy. Environmental impact, social responsibility, and strong governance practices directly influence brand reputation, funding decisions, and long-term growth. However, many organizations still struggle because ESG data remains scattered across departments, reports, and disconnected spreadsheets.
That is exactly why the ESG (Environmental, Social, and Governance) KPI Dashboard in Google Sheets becomes a critical solution.
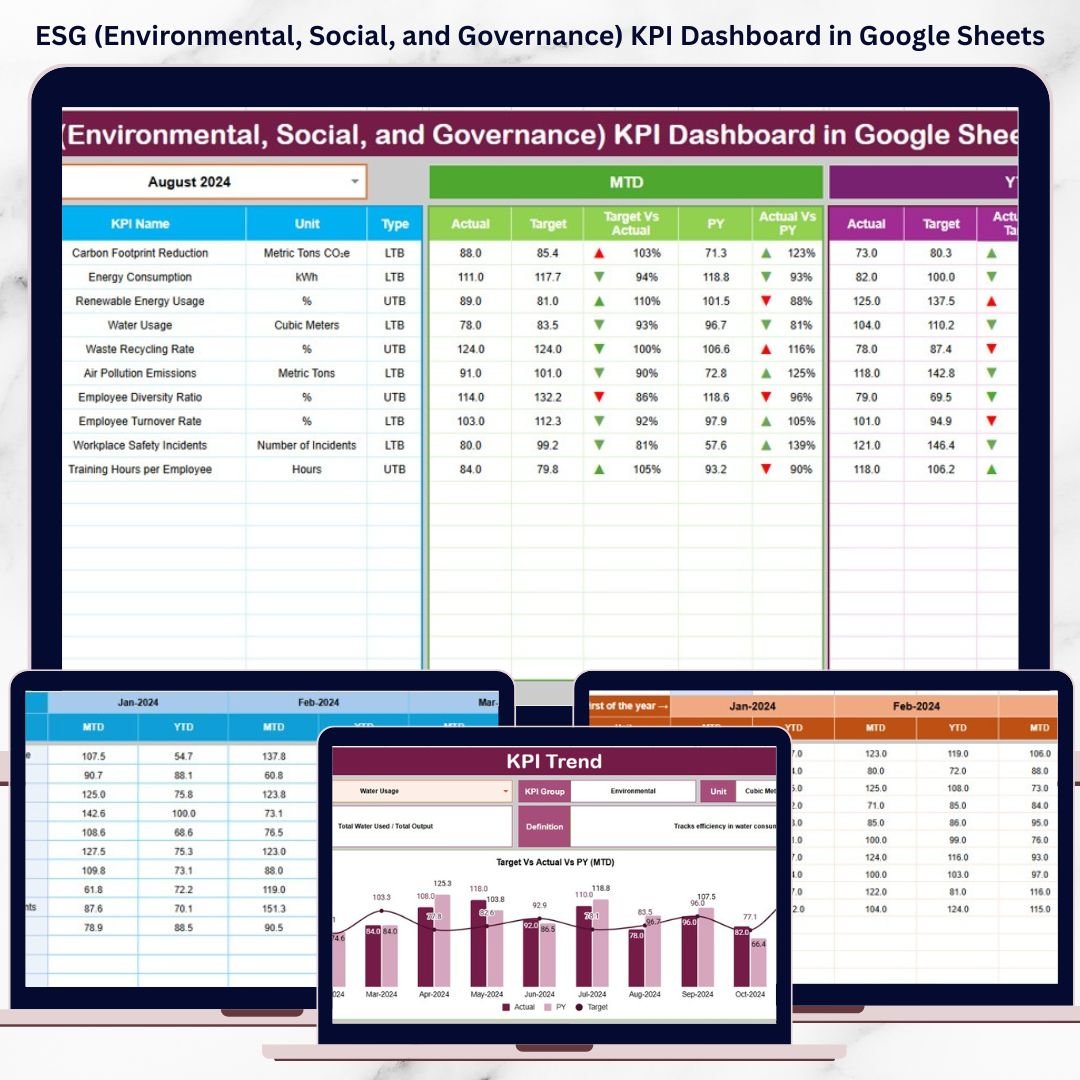
This ready-to-use ESG dashboard transforms complex sustainability data into a clear, structured, and performance-driven reporting system. Instead of manually compiling ESG reports, teams can track KPIs, compare targets, analyze trends, and demonstrate accountability—all within one collaborative Google Sheets file.
Because the dashboard is built in Google Sheets, it remains cloud-based, flexible, and cost-effective—without the need for expensive ESG software or BI tools.
🌍 Key Features of ESG (Environmental, Social, and Governance) KPI Dashboard
🌱 Environmental Performance Tracking
Monitor environmental impact using measurable KPIs such as emissions, energy use, waste reduction, and resource efficiency. Track progress against targets and compare results with previous years to support sustainability commitments.
🤝 Social Responsibility Monitoring
Measure workforce well-being, diversity, safety, training, and community initiatives. This helps organizations demonstrate social accountability and align HR, DEI, and compliance strategies.
🏛️ Governance & Compliance Visibility
Track governance metrics such as policy adherence, audit findings, compliance rates, and ethical controls. This strengthens transparency and supports regulatory and investor reporting.
📅 MTD & YTD Performance Comparison
The dashboard automatically displays:
-
MTD Actual, Target & Previous Year
-
YTD Actual, Target & Previous Year
-
Target vs Actual
-
Previous Year vs Actual
Directional arrows instantly highlight improvement or risk areas.
📦 What’s Inside the ESG KPI Dashboard
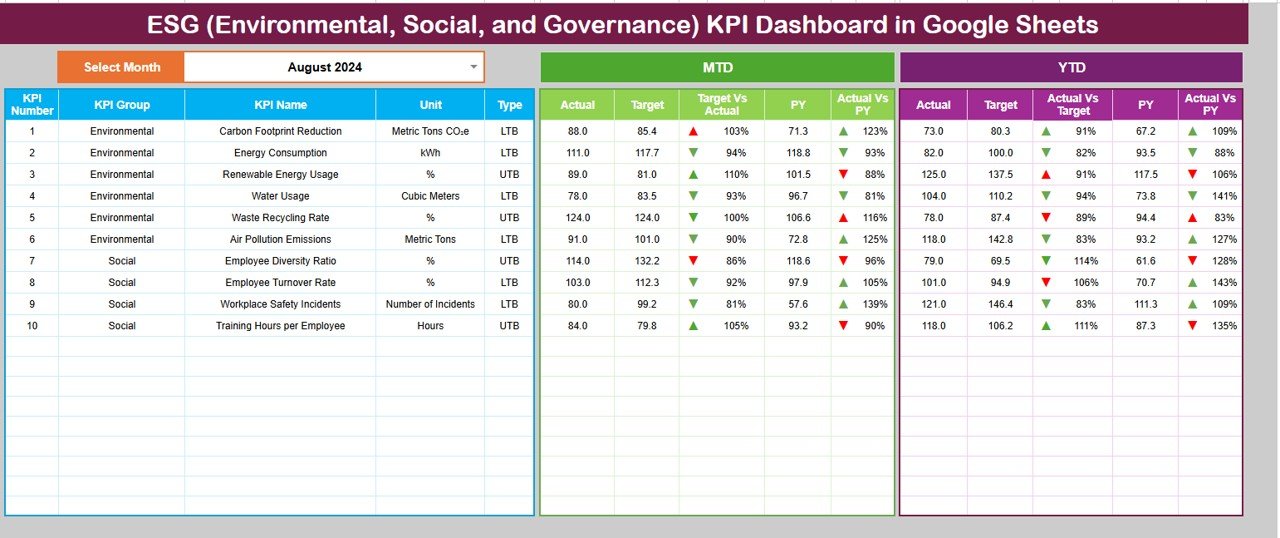
📊 Dashboard Sheet (Main ESG Overview)
This is the executive-level summary page.
-
Month selector available in cell D3
-
All ESG KPIs update automatically when the month changes
-
Conditional formatting with up/down arrows for quick interpretation
-
Ideal for board reviews, sustainability reports, and leadership meetings
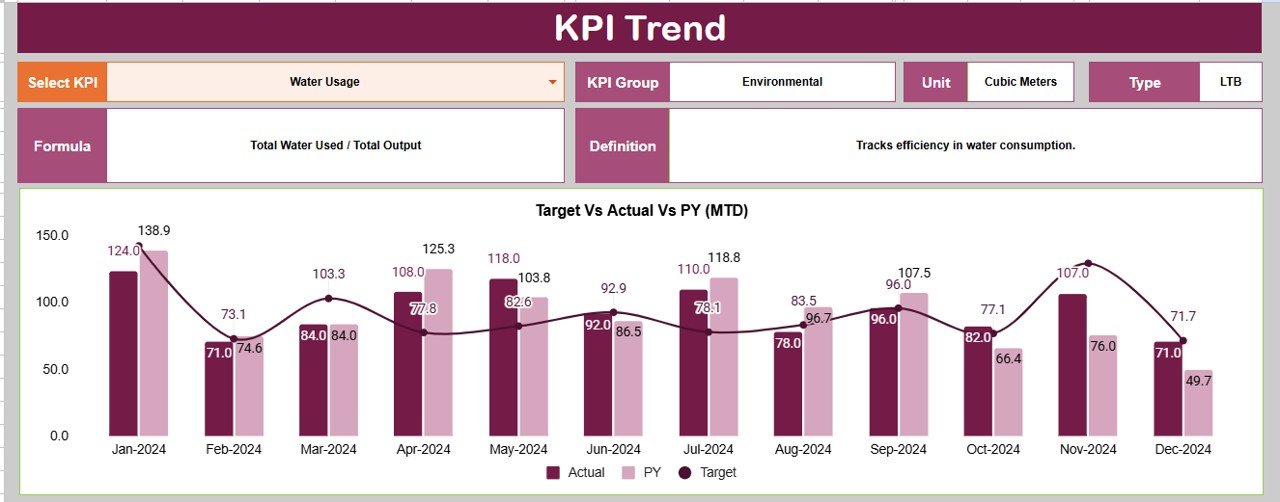
📈 KPI Trend Sheet – ESG KPI Deep Dive
This sheet allows detailed analysis of individual KPIs.
-
Select KPI from dropdown (Cell C3)
-
Displays:
-
KPI Group (Environmental / Social / Governance)
-
Unit of Measurement
-
KPI Type (Upper / Lower the Better)
-
Formula
-
Definition
-
-
Visual month-wise trends help identify progress and gaps
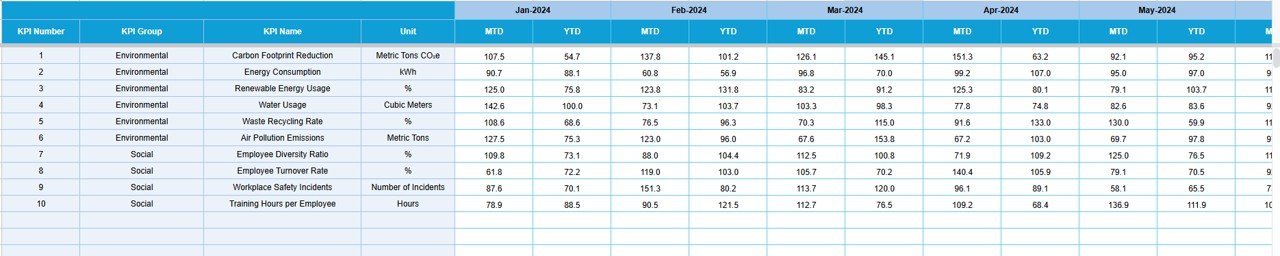
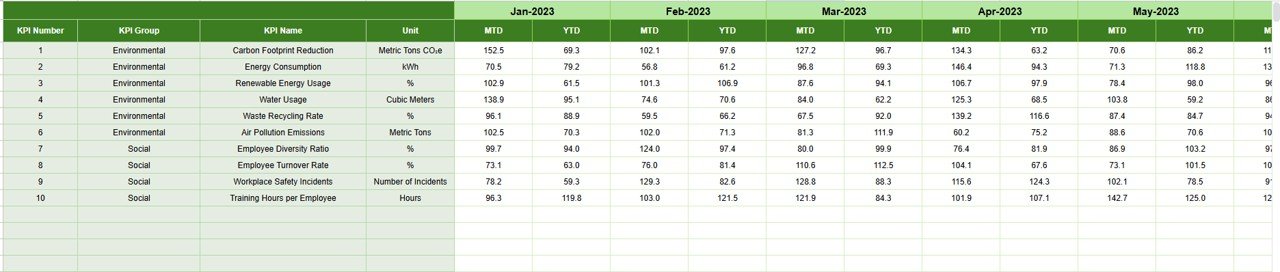
🧮 Actual Number Sheet – Real ESG Data Entry
This is where ESG performance data is entered.
-
Select first month of the year in Cell E1
-
Enter MTD and YTD Actual values
-
Dashboard updates automatically
-
Ensures clean, consistent, and auditable data capture
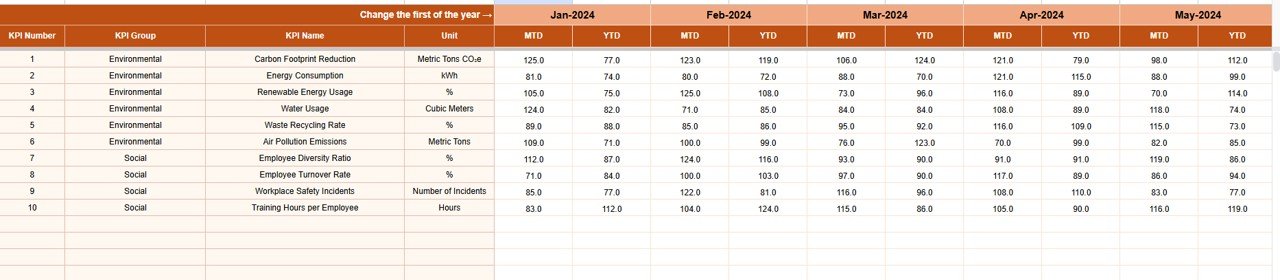
🎯 Target Sheet – ESG Goals & Benchmarks
Define sustainability goals clearly.
-
Monthly (MTD) targets
-
Annual (YTD) targets
-
Supports alignment with corporate ESG strategy and regulatory expectations
⏮️ Previous Year Number Sheet – Historical Benchmarking
Track ESG maturity over time.
-
Store last year’s MTD and YTD values
-
Enable year-over-year ESG comparison
-
Identify long-term sustainability improvements or risks
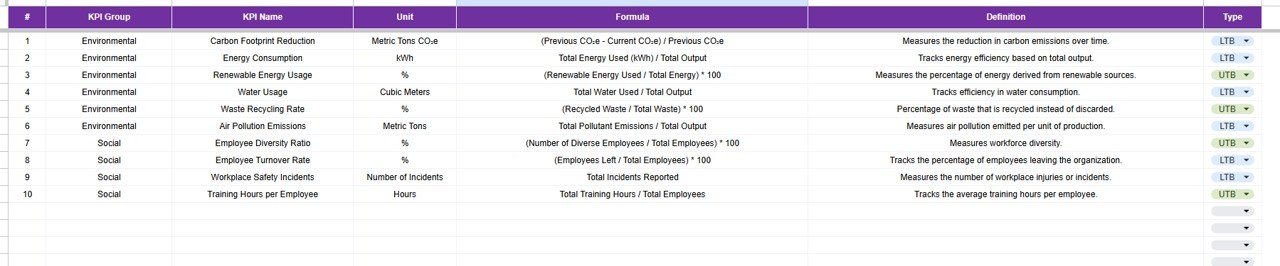
📘 KPI Definition Sheet – ESG Governance Backbone
This sheet acts as the ESG KPI master reference.
Includes:
-
KPI Name
-
ESG Pillar (E / S / G)
-
Unit
-
Formula
-
Definition
-
KPI Type (UTB / LTB)
This ensures clarity, consistency, and audit readiness across teams.
🎯 Who Can Benefit from This ESG Dashboard
-
🌍 ESG & Sustainability Teams
-
📊 Finance & Strategy Teams
-
🏛️ Compliance & Risk Teams
-
💼 Senior Management & Boards
-
🤝 Investor Relations Teams
-
🏢 Organizations preparing ESG disclosures
🌟 Advantages of Using ESG KPI Dashboard in Google Sheets
-
Centralized ESG performance tracking
-
Clear target vs actual visibility
-
Improved transparency and accountability
-
Easier investor and regulatory reporting
-
Fully customizable ESG KPIs
-
No expensive ESG software required
-
Real-time collaboration
🔮 Opportunities for Improvement
-
Scope 1, 2 & 3 emissions tracking
-
Supplier ESG scoring
-
ESG risk heatmaps
-
Automated data imports
-
Alignment with GRI / SASB frameworks
🧠 Best Practices
-
Define ESG KPIs clearly
-
Align targets with corporate strategy
-
Update data consistently
-
Review trends quarterly
-
Validate ESG data sources
-
Maintain documentation
🔗 Click here to read the Detailed blog post
Watch the step-by-step video tutorial:


Reviews
There are no reviews yet.