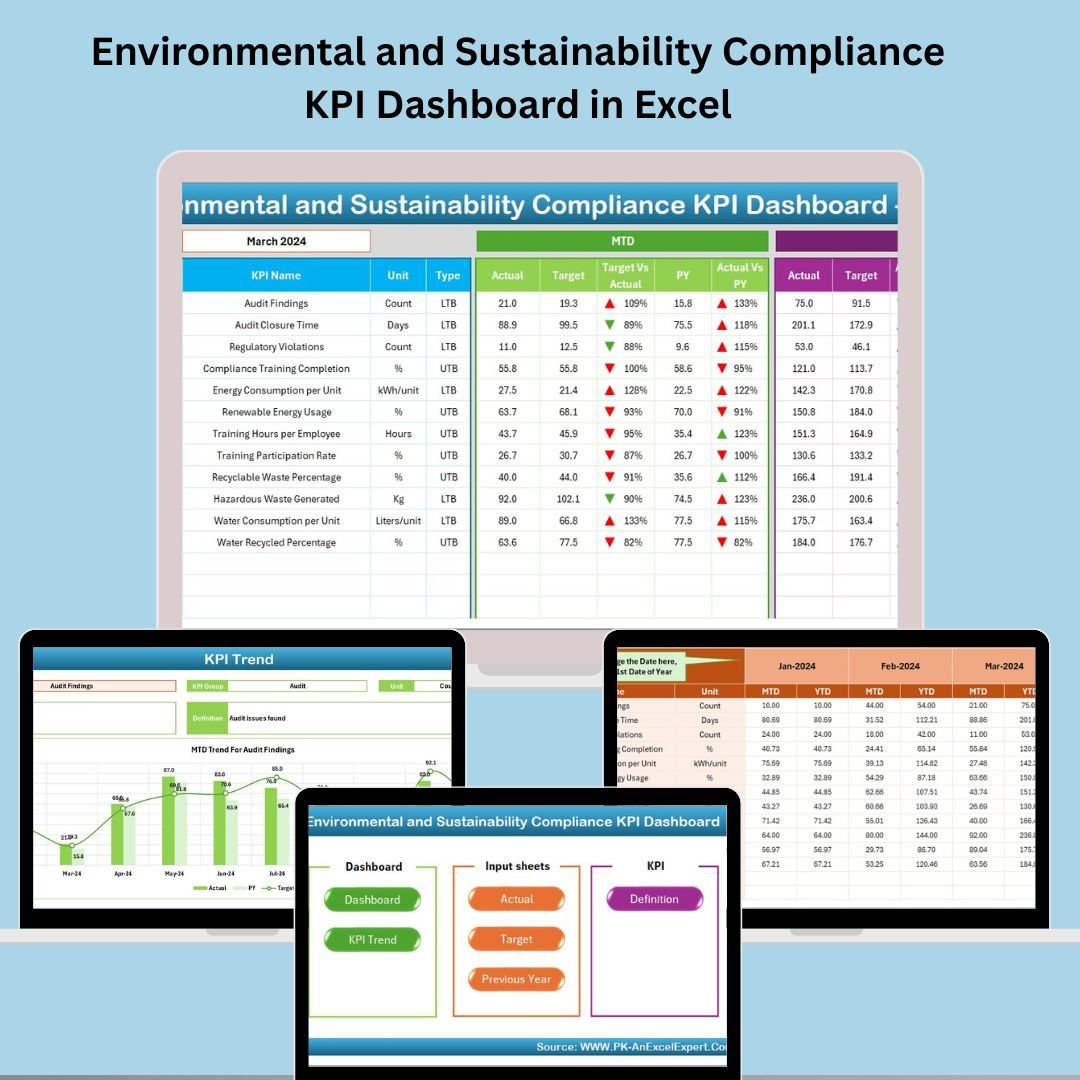
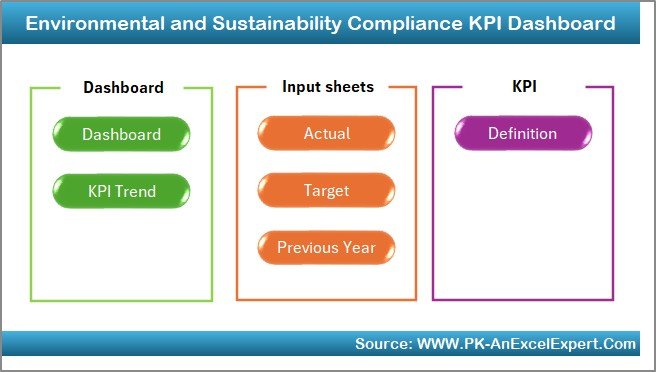
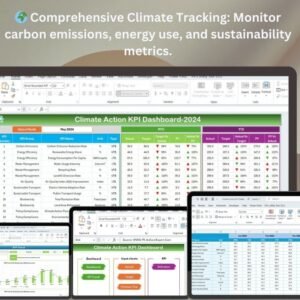
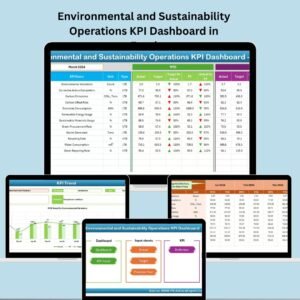
In a world where regulatory compliance and sustainability are non-negotiable, every organization needs a smart tool to keep performance in check. Enter the Environmental and Sustainability Compliance KPI Dashboard in Excel—your all-in-one, Excel-powered solution for tracking environmental KPIs, achieving compliance, and leading sustainability initiatives with data-driven clarity! 💡
This interactive dashboard is fully automated and easy to use, providing decision-makers and environmental managers with real-time insights on carbon emissions, water usage, energy efficiency, and more—without relying on expensive software. Let’s dive in! 🌍
✨ Key Features of Environmental and Sustainability Compliance KPI Dashboard
Here’s what makes this dashboard a game-changer:
🏠 Home Sheet
-
6 navigation buttons to jump across dashboard sections
-
Streamlined user experience for fast access
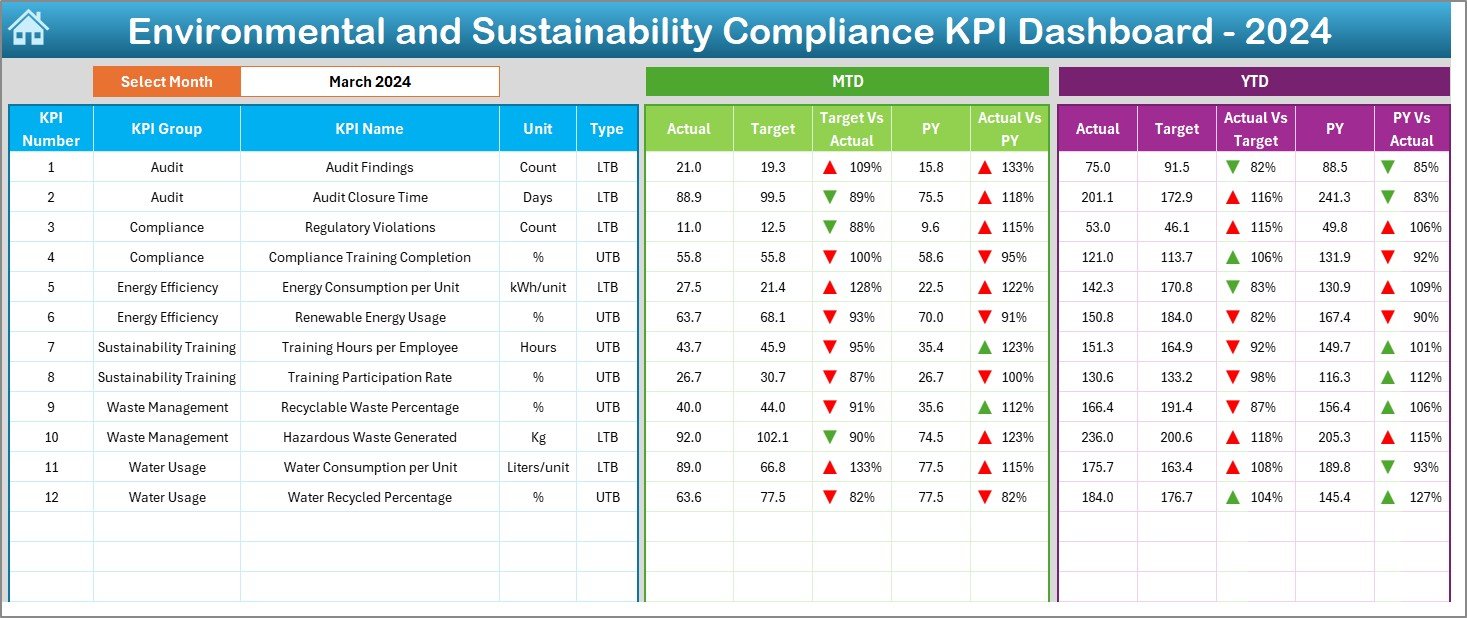
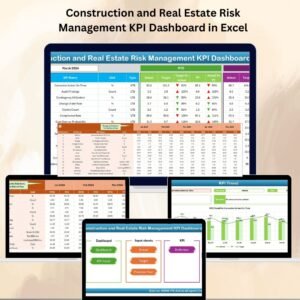
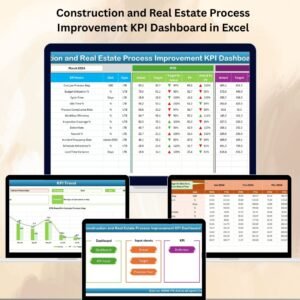
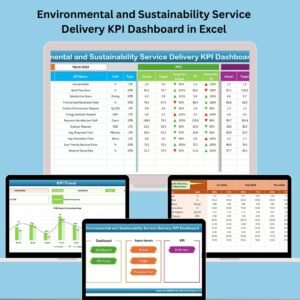
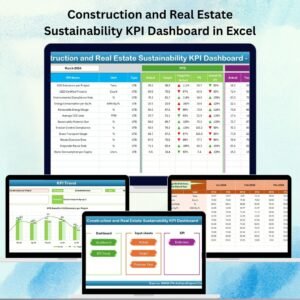
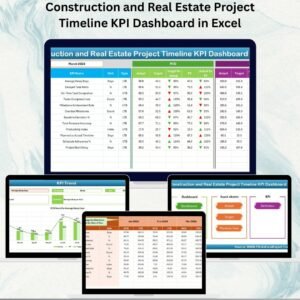
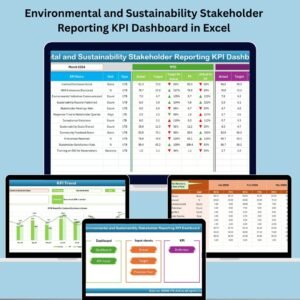
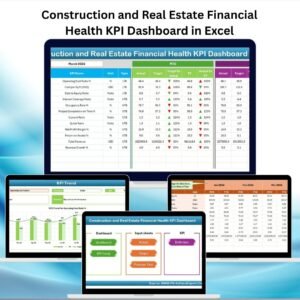
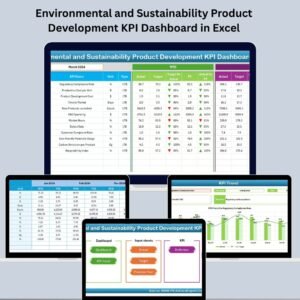
📊 Dashboard Sheet
-
Select a month in cell D3 and see metrics update instantly
-
Displays MTD/YTD values with 🔼🔽 visual indicators
-
Track Target vs. Actual and Previous Year vs. Actual
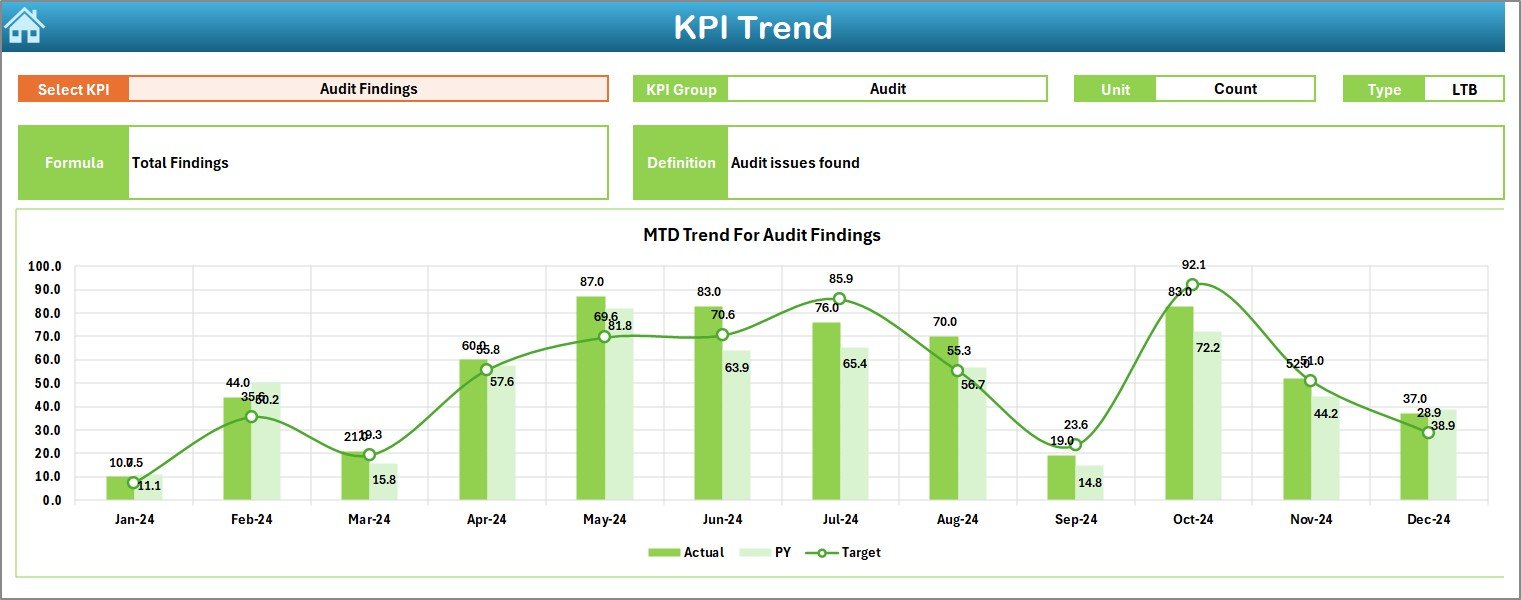
📈 KPI Trend Sheet
-
Pick a KPI from the dropdown
-
View its group, formula, type (LTB or UTB), and performance graph
-
Analyze monthly trends with side-by-side MTD & YTD charts
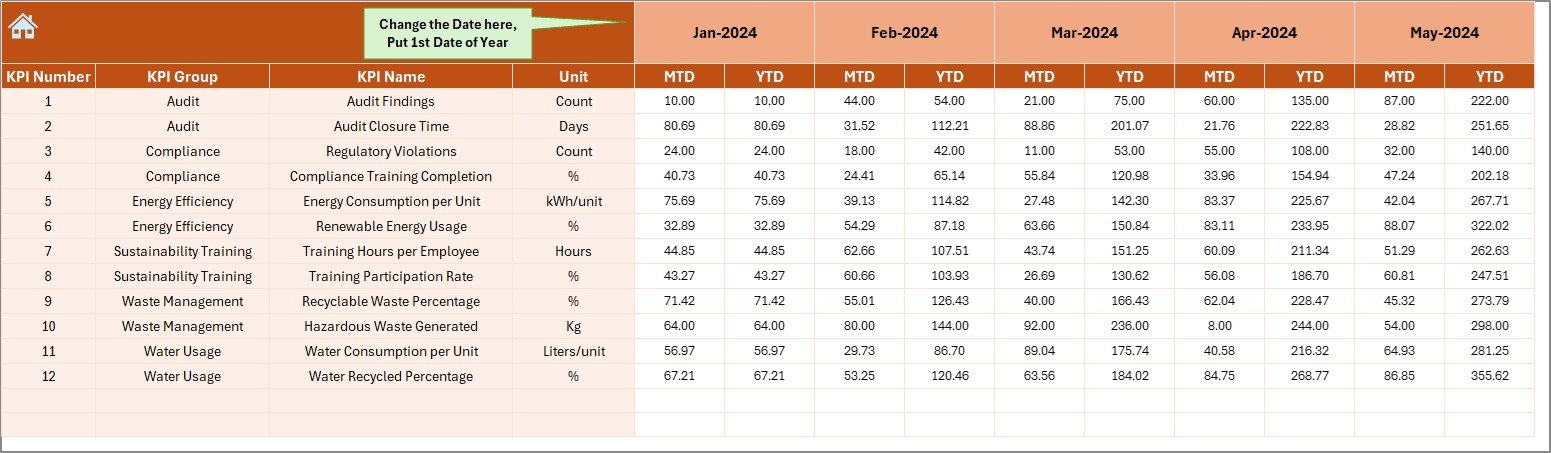
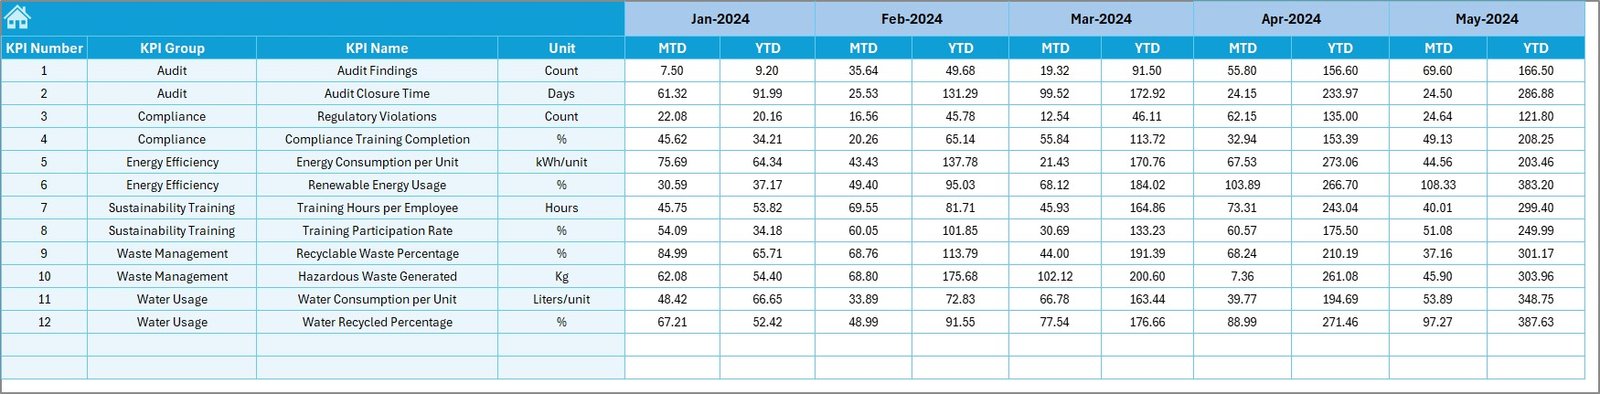
🧾 Actual Numbers Input Sheet
-
Enter monthly actuals for each KPI
-
MTD and YTD formats supported
-
Controlled by a date range selector (E1)
🎯 Target Sheet
-
Record MTD and YTD targets
-
Compare performance to goals and stay focused
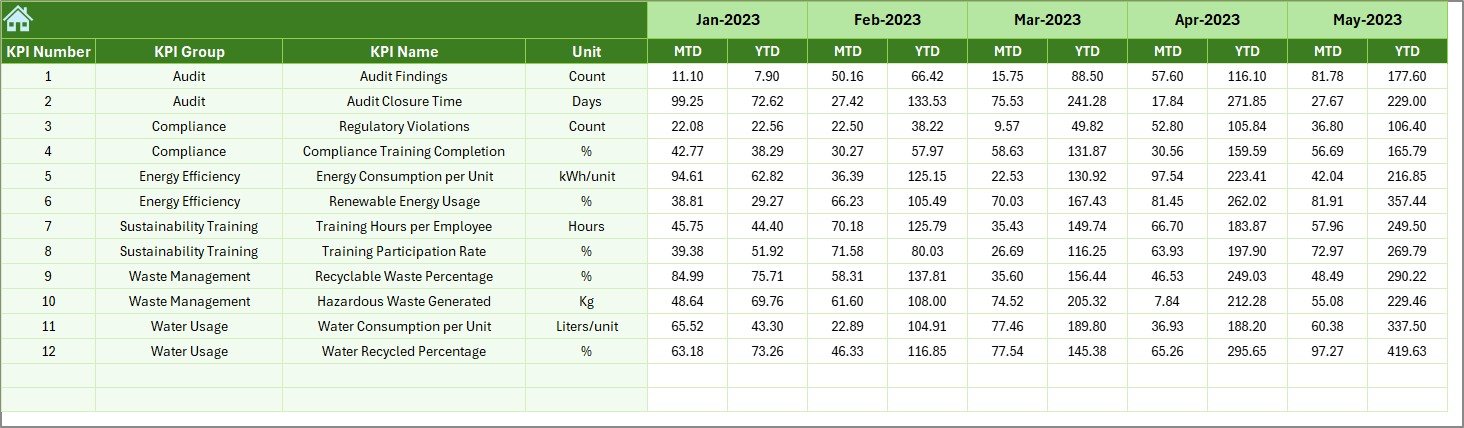
📆 Previous Year Numbers Sheet
-
Year-over-year performance tracking
-
Great for forecasting and board reporting
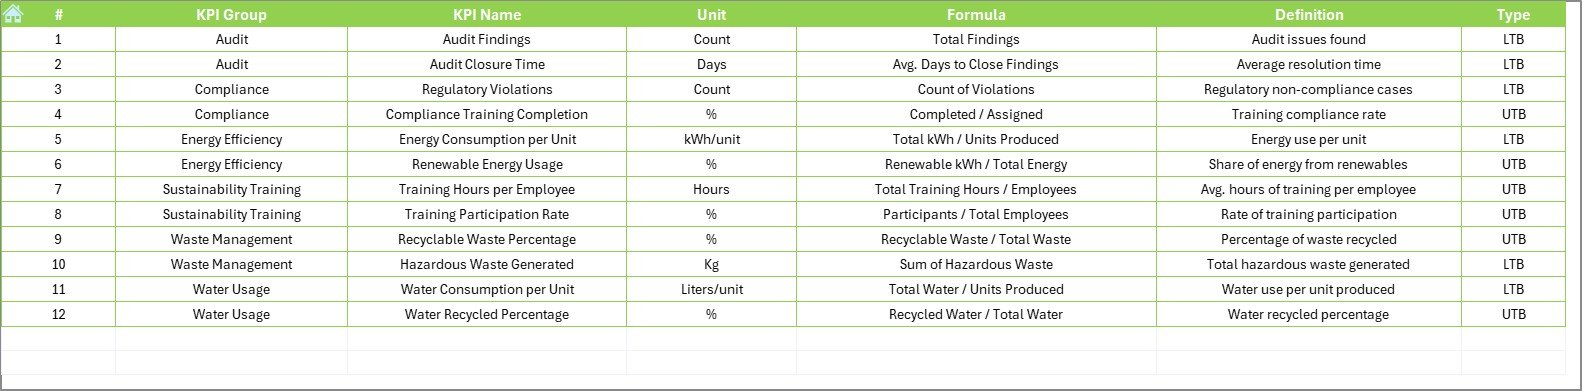
🧠 KPI Definition Sheet
-
Define each KPI with group, formula, unit, and description
-
Structured reference to keep everyone aligned
📦 What’s Inside the Dashboard?
-
7 structured worksheet tabs
-
20+ KPI tracking fields for sustainability, compliance, and environment
-
Fully editable Excel file—no software dependency!
-
Conditional formatting for instant visual feedback
-
User-friendly dropdown menus and automated calculations
🔧 How to Use the Dashboard
-
Set your start month in the Actual Numbers Input sheet
-
Define your KPIs in the KPI Definition tab
-
Enter target values in the Target tab
-
Input actual data monthly in the Actual Numbers Input tab
-
Select the month in the Dashboard tab to view updated charts
-
Analyze trends in the KPI Trend tab
-
Export or present visual summaries for compliance reviews or team meetings!
👥 Who Can Benefit from This Dashboard?
Whether you’re a sustainability officer, compliance analyst, or operations manager, this tool is made for YOU:
-
✅ Corporate Sustainability Teams: Monitor and report KPIs
-
✅ Compliance Officers: Ensure regulatory alignment
-
✅ Manufacturers & Industries: Track carbon, waste, and water usage
-
✅ Consultants: Offer clients real-time dashboards
-
✅ Small Businesses: Achieve goals with a budget-friendly tool
-
✅ ESG Reporters: Simplify data gathering for disclosures
🔗 Click here to read the Detailed blog post
📺 Visit our YouTube channel to learn step-by-step video tutorials


Reviews
There are no reviews yet.