
Energy trading is fast, complex, and highly data-driven. Traders and analysts must continuously monitor prices, volumes, margins, targets, and risks to stay competitive. However, when KPIs are scattered across multiple sheets or systems, performance tracking becomes slow, inconsistent, and unreliable. As a result, decisions are delayed and risk exposure increases.Energy Trading KPI Dashboard in Google Sheets
That is exactly why the Energy Trading KPI Dashboard in Google Sheets is a critical solution for energy trading teams.
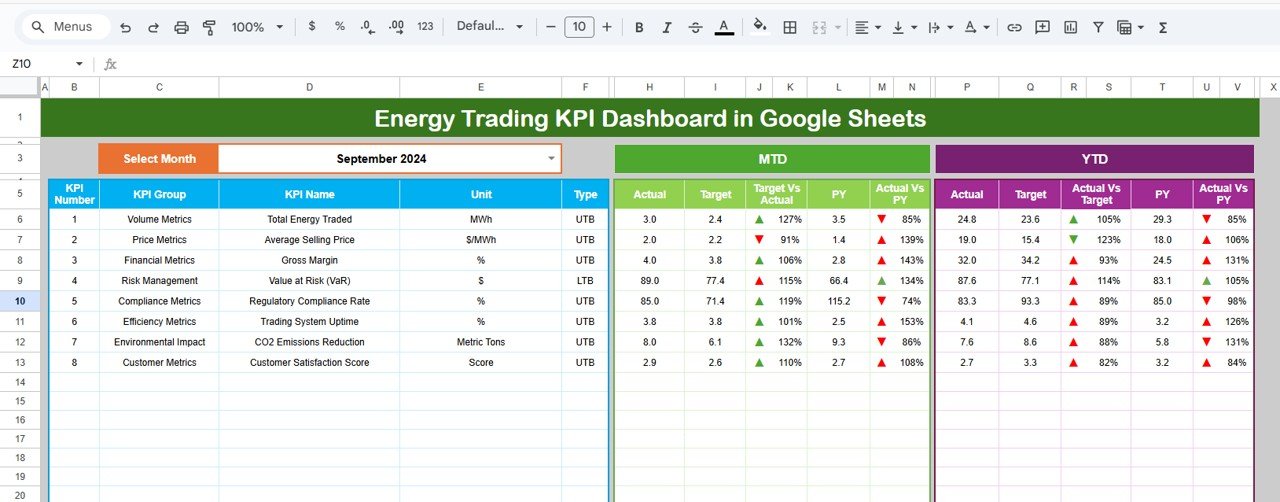
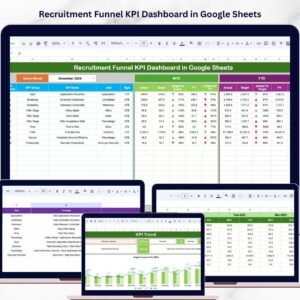
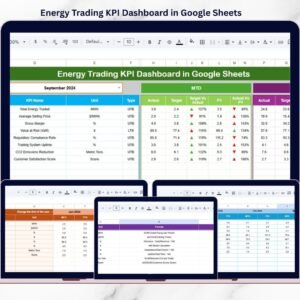
This ready-to-use Google Sheets KPI dashboard provides a structured, centralized, and visual way to track energy trading performance. Instead of manual calculations or complex tools, the dashboard delivers MTD and YTD performance, Target vs Actual comparison, Previous Year benchmarking, and KPI trends in one professional reporting system.
Because it is built entirely in Google Sheets, the dashboard is easy to update, simple to share, and perfect for real-time collaboration across trading, finance, and management teams.
## 🚀 Key Features of Energy Trading KPI Dashboard in Google Sheets
📊 MTD & YTD KPI Tracking
Monitor Month-to-Date and Year-to-Date performance for all trading KPIs.
🎯 Target vs Actual Comparison
Instantly identify whether performance is meeting defined targets.
📅 Previous Year Benchmarking
Compare current results with last year to measure real growth or decline.
📈 KPI Trend Analysis
Analyze historical performance trends for individual KPIs.
🚦 Conditional Formatting Indicators
Up and down arrows highlight good or poor performance instantly.
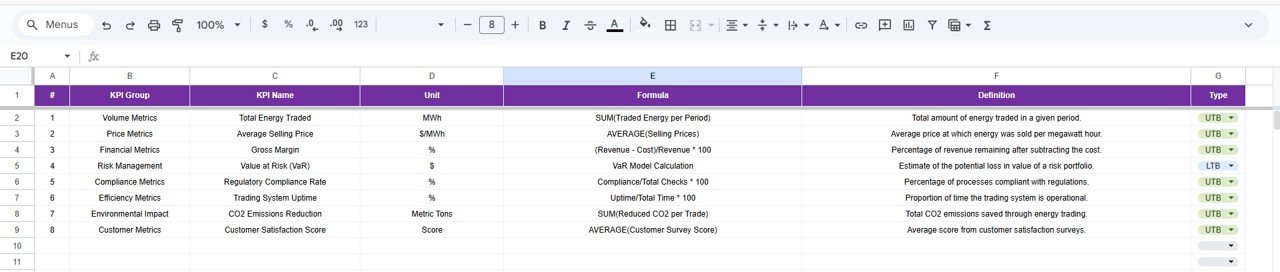
🧮 Structured KPI Definition Framework
Each KPI includes unit, formula, definition, and performance type.
🎛️ Month & KPI Selection Controls
Dynamic dropdowns allow quick KPI and period analysis.
☁️ 100% Google Sheets Based
No complex systems—simple, collaborative, and cloud-ready.
## 📦 What’s Inside the Energy Trading KPI Dashboard
📄 Dashboard Sheet
The main reporting page showing MTD and YTD Actuals, Targets, Previous Year values, and performance variance with visual indicators.
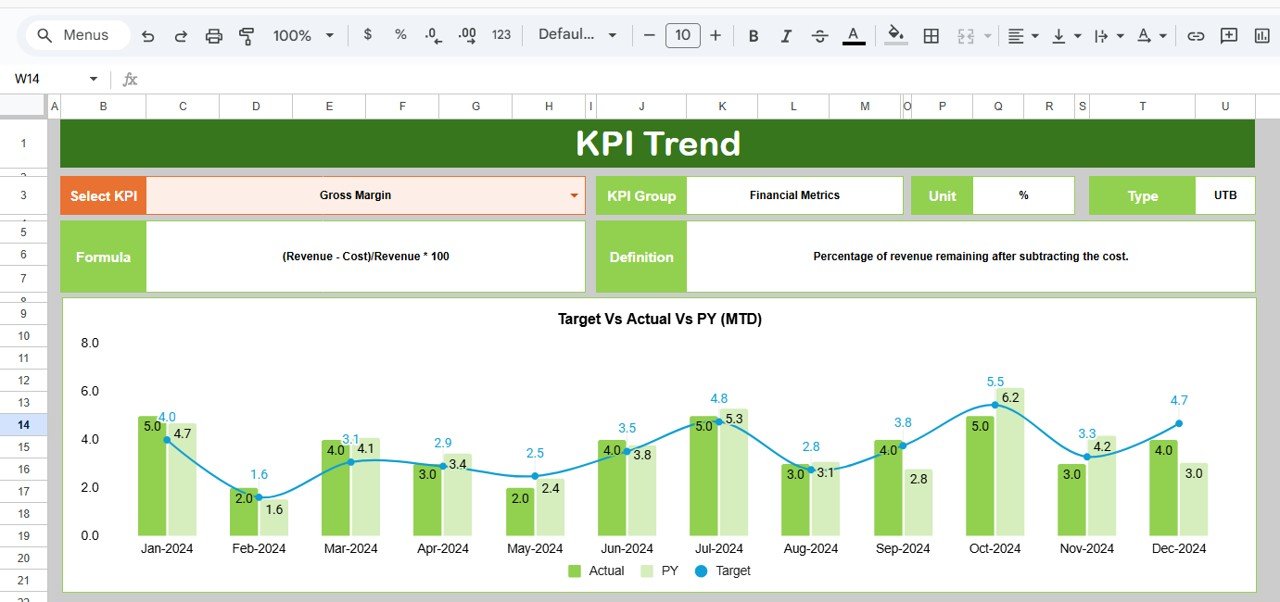
📉 KPI Trend Sheet
Analyze individual KPI trends over time with detailed KPI context such as unit, type, formula, and definition.
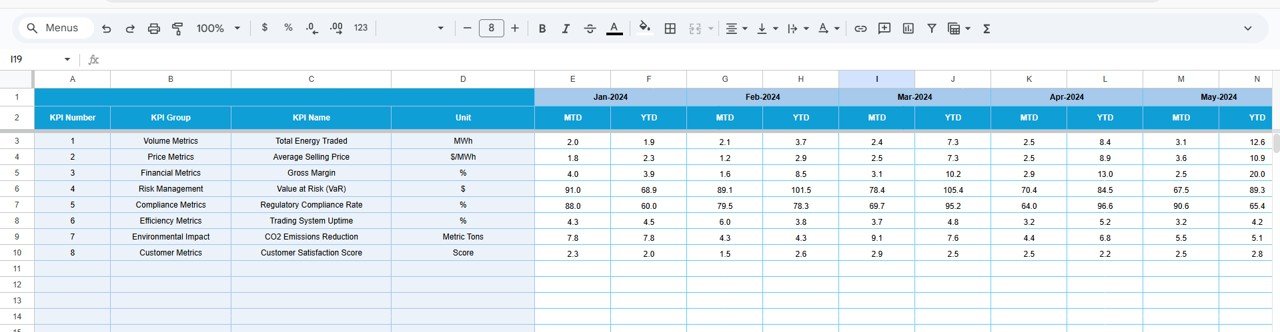
🧾 Actual Number Sheet
Structured input sheet to capture monthly MTD and YTD actual performance data.
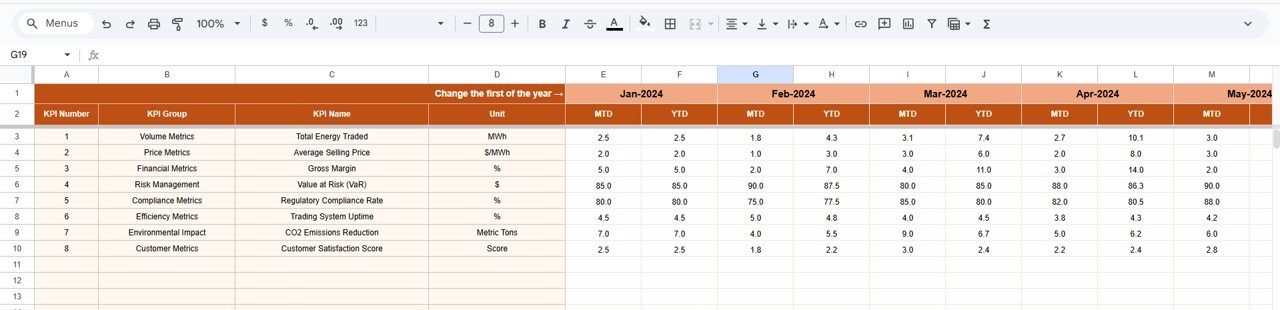
🎯 Target Sheet
Define MTD and YTD targets for each KPI to drive performance comparison.
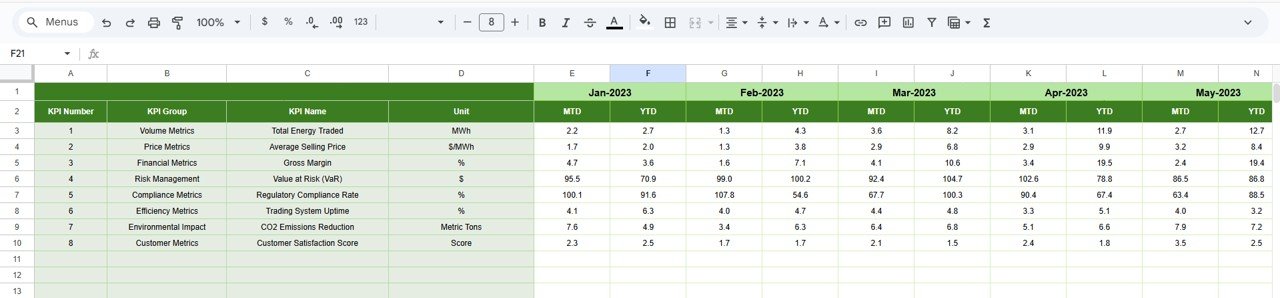
📆 Previous Year Number Sheet
Store historical KPI values for year-over-year analysis.
📘 KPI Definition Sheet
Central reference sheet containing KPI Name, Group, Unit, Formula, Definition, and KPI Type (UTB / LTB).
## 🛠️ How to Use the Energy Trading KPI Dashboard
1️⃣ Enter monthly actual KPI values in the Actual Number sheet
2️⃣ Set performance targets in the Target sheet
3️⃣ Add previous year data for benchmarking
4️⃣ Select the desired month from the Dashboard dropdown
5️⃣ Review MTD and YTD performance instantly
6️⃣ Use the KPI Trend sheet for deeper analysis
7️⃣ Share the dashboard with stakeholders for collaboration
No advanced Google Sheets skills required—the dashboard is structured, intuitive, and ready to use.
## 🎯 Who Can Benefit from This Energy Trading KPI Dashboard
⚡ Energy Trading Firms
🏭 Power & Utility Companies
🛢️ Oil, Gas & Commodity Traders
📊 Trading & Risk Analysts
💼 Finance & Performance Teams
📈 Energy Portfolio Managers
This dashboard is ideal for teams that want clarity, control, and confidence in energy trading decisions.
### 👉 Click here to read the Detailed blog post
Watch the step-by-step video tutorial:


Reviews
There are no reviews yet.