


Managing employee workload is becoming more challenging than ever. As teams grow, deadlines tighten, and projects run simultaneously, managers often struggle to see who is doing what—and whether the workload is balanced. That’s where the Employee Workload Dashboard in Excel becomes your most powerful reporting tool.Employee Workload Dashboard in Excel
This ready-to-use dashboard gives you a clear and automated view of task allocation, workload distribution, estimated hours, performance percentages, and monthly trends—all in one place. Whether you manage a small team or a large organization, this dashboard helps you make faster, smarter, and more confident decisions.
With beautifully designed visuals, interactive insights, and automated formulas, this tool eliminates manual reporting and helps you track your team’s workload effortlessly.
✨ Key Features of Employee Workload Dashboard in Excel
This dashboard is thoughtfully designed to give managers complete clarity and control over workload, performance, and utilization.
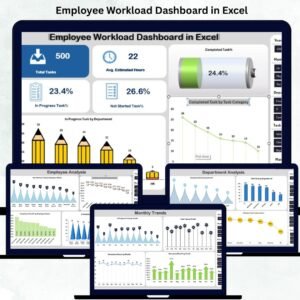
📌 1. Overview Dashboard for Instant Insights
The Overview page provides real-time visibility of workload patterns using:
-
Total Tasks
-
Average Estimated Hours
-
In-Progress Task %
-
Not Started Task %
-
Completed Task %
It also includes powerful charts such as:
-
In Progress Tasks by Department
-
Completed Tasks by Category
-
Department-wise Completion %
-
Department-wise In Progress %
These visuals help you understand progress, spot bottlenecks, and plan actions quickly.
📌 2. Employee Analysis Section
Track productivity and workload at the individual employee level. This sheet shows:
-
Not Started Task %
-
Completed Task %
-
Estimated Hours by Employee
-
In Progress Task %
This helps you identify overloaded employees, underutilized talent, and performance trends instantly.
📌 3. Department-Level Reporting
Get a clear departmental workload overview with:
-
Total Tasks by Department
-
Completed Task %
-
In Progress %
-
Department-wise Task Counts
Managers can compare performance, identify imbalances, and make smarter resource allocation decisions.
📌 4. Category Analysis for Project Insights
Monitor project categories, identify heavy workloads, and analyze task trends. It includes:
-
Estimated Hours by Category
-
Completed Task % by Category
-
In Progress Task %
-
In Progress Task Counts
Perfect for cross-functional teams working on diverse project types.
📌 5. Monthly Trends for Better Planning
Understand long-term workload changes with:
-
In Progress Tasks
-
Monthly Estimated Hours
-
Total Tasks
-
Monthly Completion %
These insights help you plan hiring, distribute work fairly, and avoid workload spikes.

📦 What’s Inside the Employee Workload Dashboard
When you download this product, you get:Employee Workload Dashboard in Excel
✔ A Fully Interactive Excel Dashboard
All visuals, charts, and KPIs are automated and require zero technical expertise.
✔ Data Entry Sheet
Enter tasks, estimated hours, employees, and departments—Excel does the rest.
✔ Multiple Analysis Tabs
-
Overview
-
Employee Analysis
-
Department Analysis
-
Category Analysis
-
Monthly Trends
✔ Pre-Built Formulas & Conditional Formatting
Everything updates automatically when you refresh the data.Employee Workload Dashboard in Excel
✔ Clean, Modern & Professional Design
Simple, clutter-free visuals created for business decision-making.
🛠️ How to Use the Employee Workload Dashboard
Using the dashboard is extremely simple:
1️⃣ Add Your Data
Enter employee name, task, department, category, and estimated hours into the Data sheet.
2️⃣ Refresh the Dashboard
All visuals update instantly—no coding or advanced Excel knowledge needed.
3️⃣ Analyze Task Distribution
Start at the Overview page to see task counts and workload balance.
4️⃣ Review Employee Performance
Check the Employee Analysis sheet to find overloaded or underutilized team members.
5️⃣ Compare Department Load
Use Department Analysis to ensure work is evenly spread.Employee Workload Dashboard in Excel
6️⃣ Monitor Trends Over Time
Monthly Trends help you forecast busy months and prepare resources accordingly.
🎯 Who Can Benefit From This Employee Workload Dashboard?
This dashboard is ideal for:
👩💻 Project Managers
Assign tasks wisely, prevent overload, and improve project delivery.
👨💼 HR Managers
Monitor employee productivity, workload balance, and performance trends.
🏢 Department Heads
Compare workloads across teams and optimize task assignments.
📊 Business Owners & Startup Founders
Get a complete view of team productivity without costly software.
📚 Team Leaders
Plan better, communicate clearly, and manage tasks with precision.
👥 Operations & Workforce Planning Teams
Analyze workload trends for future staffing decisions.
Whether you’re a beginner or an Excel expert, this dashboard is plug-and-play—just enter your data and start analyzing.
### Click Here to Read the Detailed Blog Post
Watch the step-by-step video tutorial:


Reviews
There are no reviews yet.