Employee satisfaction is the heartbeat of any successful organization. A motivated, engaged, and happy workforce drives productivity, reduces turnover, and contributes to a positive workplace culture. But how can businesses measure and track satisfaction effectively without getting lost in scattered survey data and endless spreadsheets?
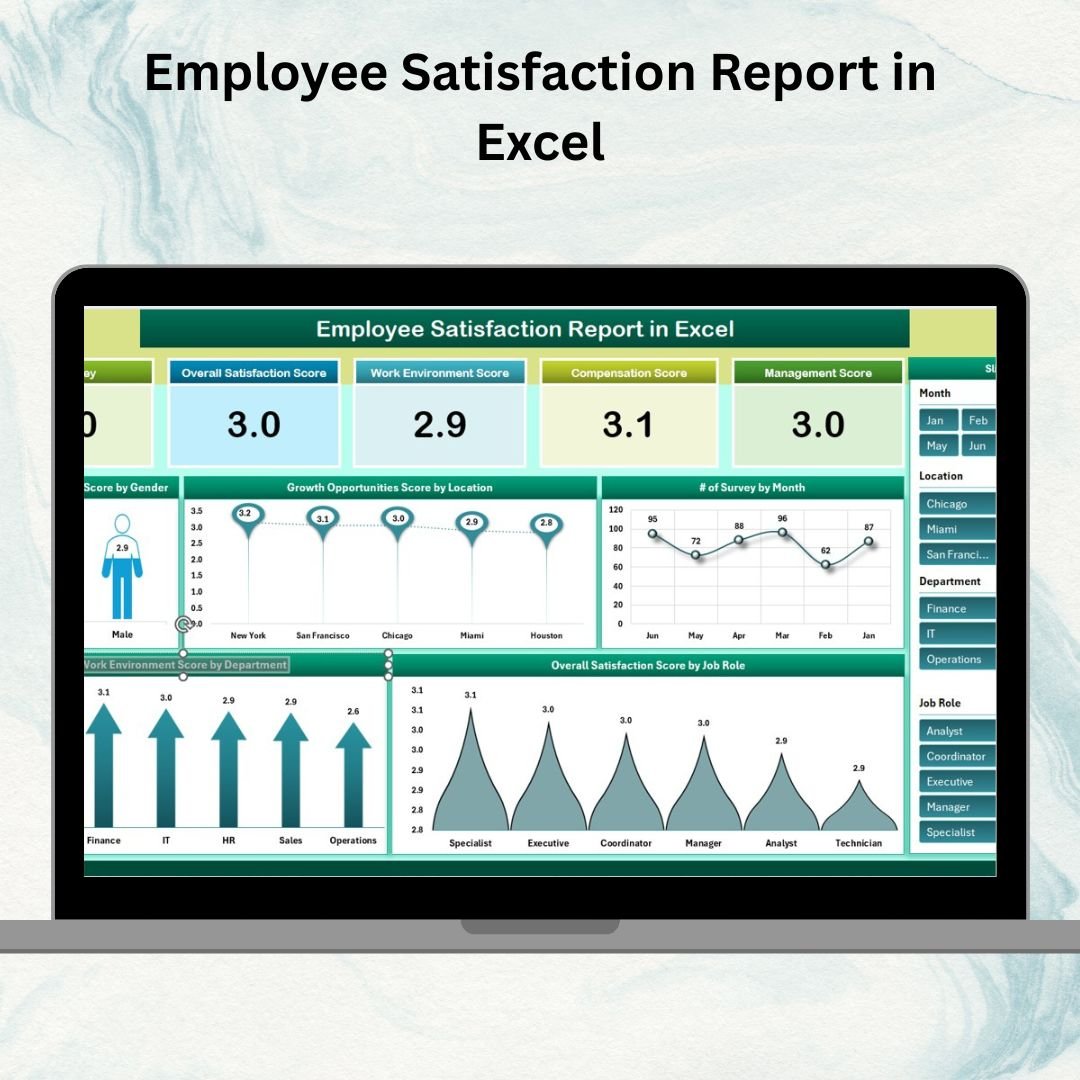
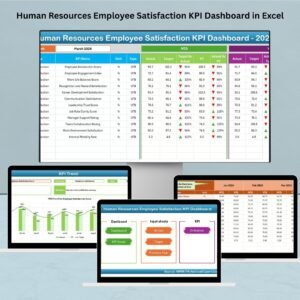
That’s where our Employee Satisfaction Report in Excel comes in—a ready-to-use, interactive, and professional tool designed to simplify employee feedback management. Built entirely in Excel, it provides HR managers, team leaders, and business executives with clear insights into employee sentiment across multiple dimensions such as work environment, compensation, management, and growth opportunities.
By consolidating survey data into a structured format, this report ensures organizations can monitor overall satisfaction, analyze trends, and take data-driven action to improve employee experience.
🔑 Key Features of the Employee Satisfaction Report
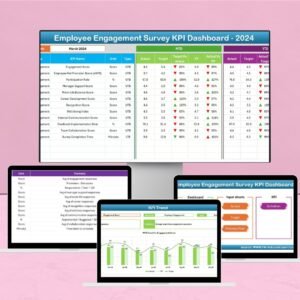
1️⃣ Summary Sheet – The Main Dashboard
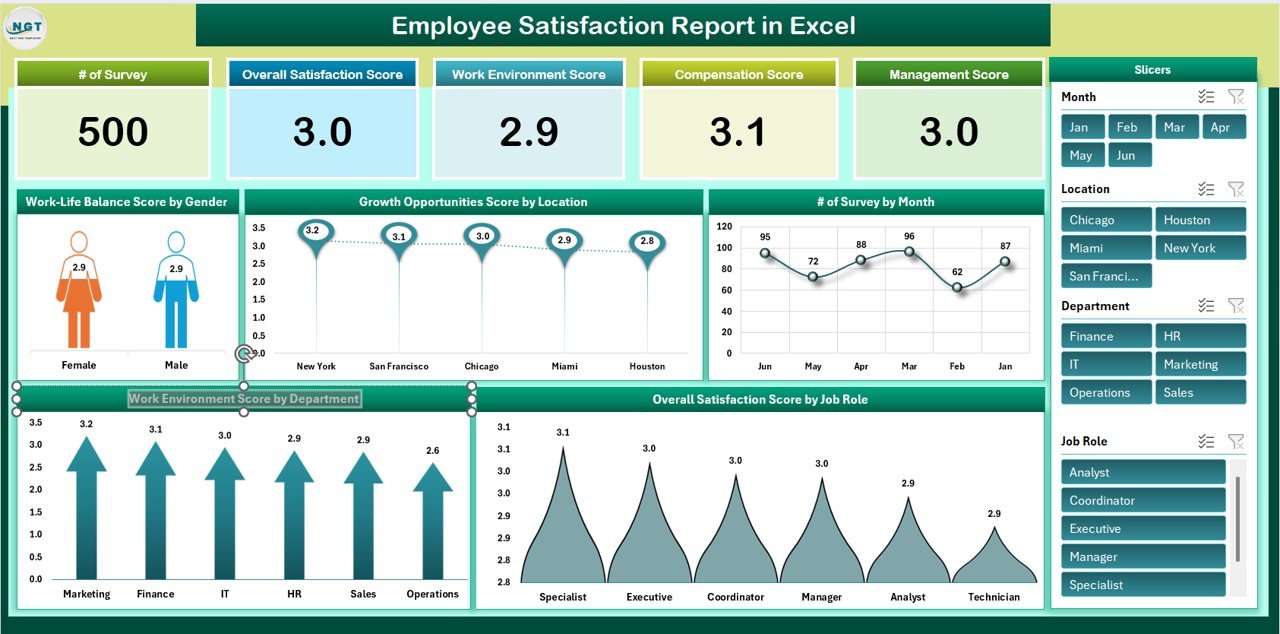
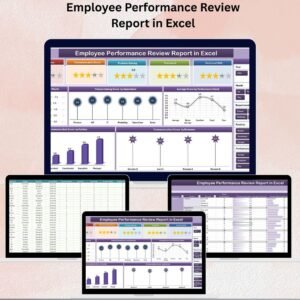
The Summary Sheet provides a high-level snapshot of employee satisfaction using cards, charts, and pivot-based reports.
-
Cards (Key Metrics):
-
of Surveys – Total employee responses collected.
-
Overall Satisfaction Score – The average score across all survey participants.
-
Work Environment Score – Ratings on workplace conditions.
-
Compensation Score – Employee satisfaction with salary & benefits.
-
Management Score – Ratings of leadership effectiveness.
-
-
Charts (Visual Insights):
-
Work-Life Balance Score by Gender – Compare satisfaction trends between male & female employees.
-
Growth Opportunities by Location – Identify differences in career advancement perceptions.
-
of Surveys by Month – Monitor participation trends.
-
Overall Satisfaction Score by Job Role – Spot variations across roles.
-
Work Environment Score by Department – Identify strong and weak departments.
-
This dashboard provides instant clarity into workforce sentiment.
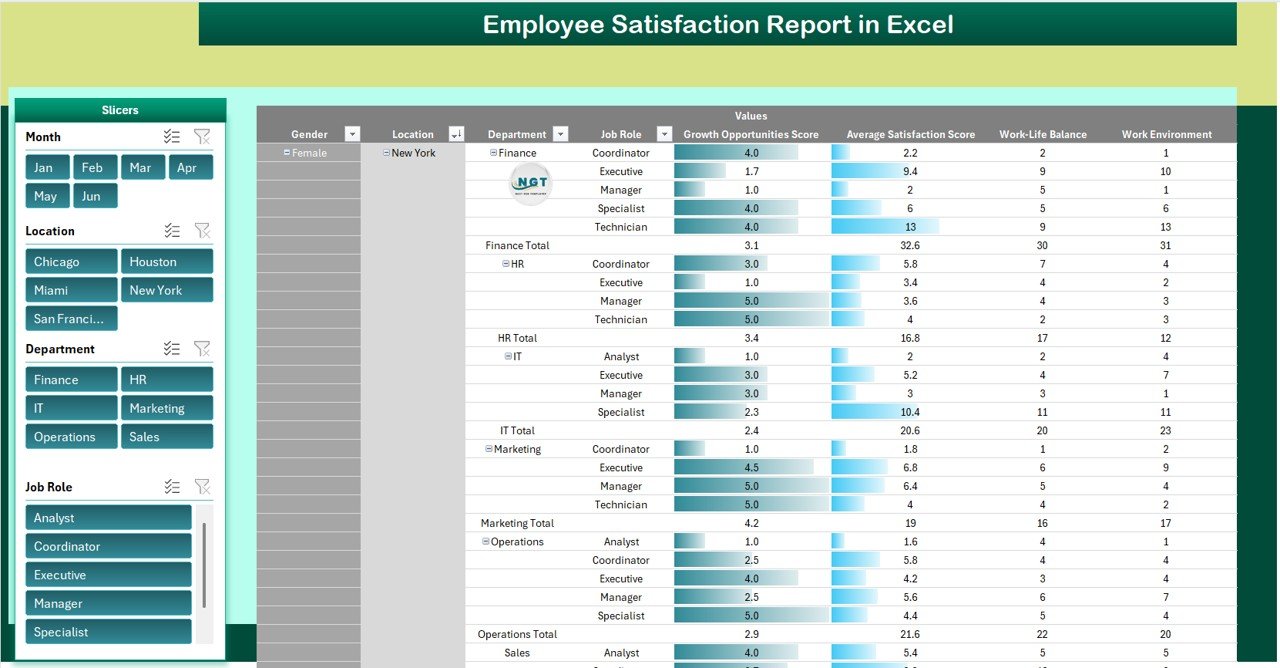
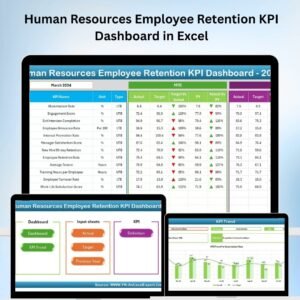
2️⃣ Report Sheet – Power Pivot Analysis
For deeper exploration, the Report Sheet allows you to slice and dice data using filters:
-
Filter by Department, Job Role, Location, or Gender.
-
Generate customized insights for management meetings.
-
Compare results across segments for targeted decision-making.
This feature makes it easy for HR teams to drill down into trends and identify problem areas.
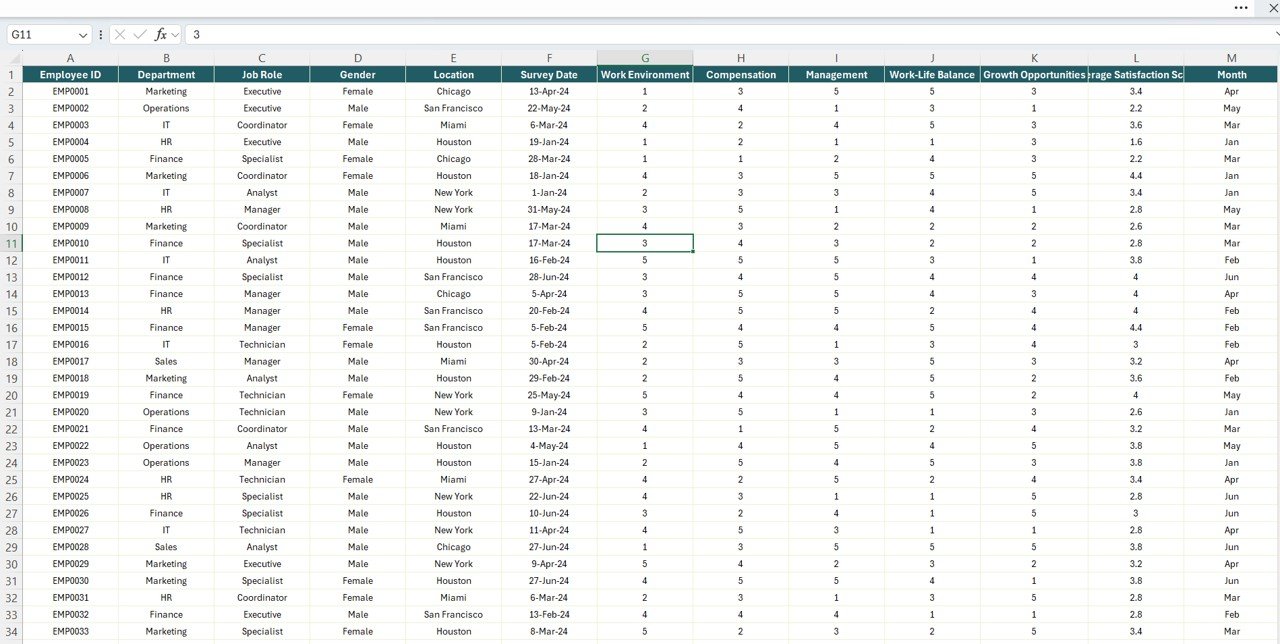
3️⃣ Data Sheet – Centralized Feedback Input
The Data Sheet is the backbone of the system. It captures all employee survey responses in a structured way:
-
Employee ID / Name
-
Department
-
Job Role
-
Location
-
Survey Date
-
Scores: Work Environment, Compensation, Management, Work-Life Balance, Growth Opportunities
Once entered, the data automatically updates the Summary and Report Sheets, ensuring real-time accuracy.
📊 Advantages of Using This Report
✅ Centralized Feedback – Keep all survey data in one easy-to-manage file.
✅ Visual Insights – Charts & KPIs simplify analysis of employee satisfaction.
✅ Department & Role Comparisons – Quickly identify strong and weak areas.
✅ Customizable – Add new KPIs, questions, or fields to match your HR needs.
✅ Data-Driven Decisions – Improve retention and engagement with accurate insights.
✅ Trend Tracking – Monitor monthly or yearly changes to measure progress.
🚀 Best Practices
-
Conduct surveys regularly (monthly or quarterly).
-
Keep responses anonymous to encourage honesty.
-
Use departmental filters for precise insights.
-
Share high-level results with employees to build trust.
-
Focus on key drivers (work environment, compensation, management, growth).
-
Take visible action on low-scoring areas.
⚡ Opportunities for Improvement
-
Automation: Connect with survey tools like Google Forms for direct data input.
-
Benchmarking: Add industry comparison KPIs.
-
Trend Analysis: Introduce month-over-month charts.
-
Qualitative Feedback: Add open-ended comments alongside ratings.
-
Departmental Reports: Generate auto-updated reports per department.
✅ Conclusion
The Employee Satisfaction Report in Excel is a powerful, cost-effective solution for organizations that want to improve employee engagement and workplace culture. By tracking key satisfaction drivers—work environment, compensation, management, and growth opportunities—this report empowers HR leaders and managers to understand employees better, act faster, and build a happier workforce.
Click here to read the Detailed Blog Post
Watch the step-by-step video Demo:


Reviews
There are no reviews yet.