


In today’s fast-changing world of electronics retail, success depends on how well you track sales, manage inventory, and analyze performance. The Electronics Retail KPI Dashboard in Excel 📊 is your all-in-one solution to monitor, measure, and visualize business performance effortlessly — built entirely in Microsoft Excel!
This interactive, ready-to-use Excel dashboard consolidates your sales, customer, and inventory data into one visual interface. Whether you manage a single store or multiple outlets, this tool empowers you to make smarter, faster, and more profitable decisions.
⚡ Key Features of Electronics Retail KPI Dashboard in Excel
✅ Interactive Dashboard View: Switch between Month-to-Date (MTD) and Year-to-Date (YTD) results instantly.
✅ Dynamic Month Selector: Select any month from the dropdown in cell D3 — all visuals and numbers update automatically!
✅ Actual vs Target Comparison: See how your KPIs perform against goals and previous year benchmarks.
✅ Conditional Formatting Indicators: Up 🔼 or down 🔽 arrows highlight performance trends visually.
✅ Clean & Compact Layout: Get a complete view of sales, customers, and inventory KPIs in one sheet.
✅ Automated Calculations: Formulas handle everything — no manual updates or VBA required.
✅ Customizable & Scalable: Add new KPIs or modify visuals to suit your retail business model.
✅ Budget-Friendly Tool: Get business intelligence–level insights using Excel — no extra software cost.
From store managers to senior executives, everyone can understand and act on data using this intuitive dashboard.
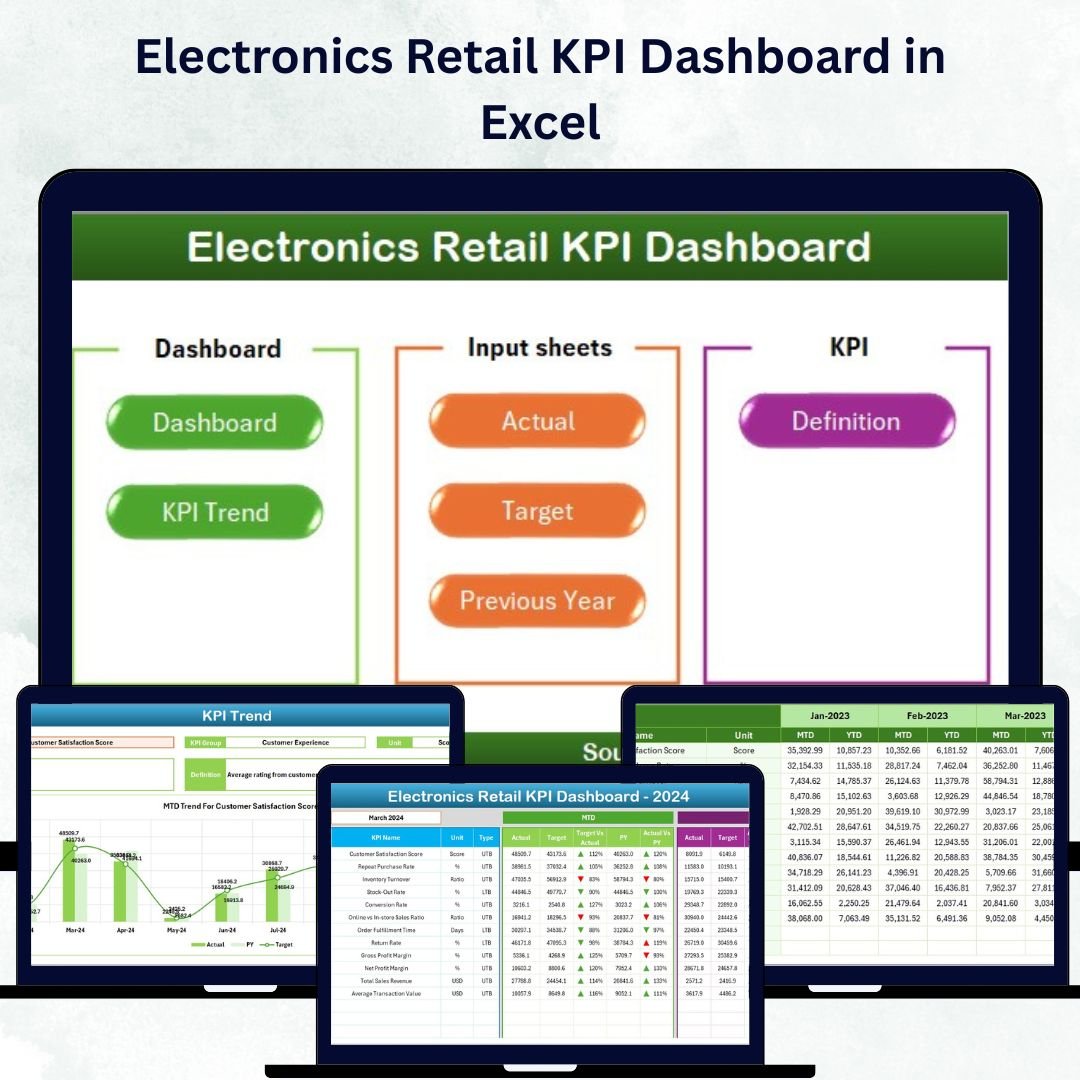
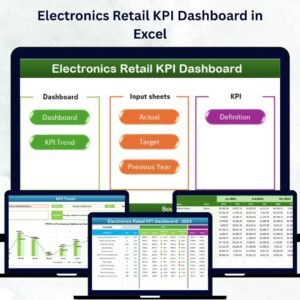
🧩 What’s Inside the Electronics Retail KPI Dashboard in Excel

The template is structured across seven smart worksheet tabs, each serving a unique analytical purpose:
1️⃣ Home Sheet: Acts as a navigation hub with six clickable buttons for quick access to each worksheet.
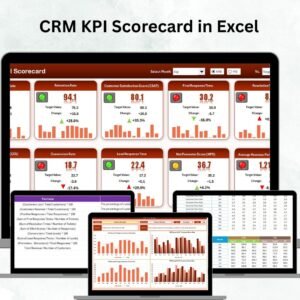
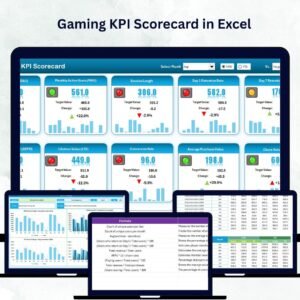
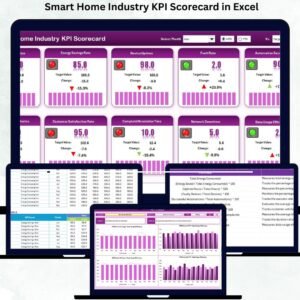
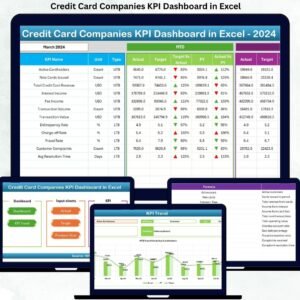
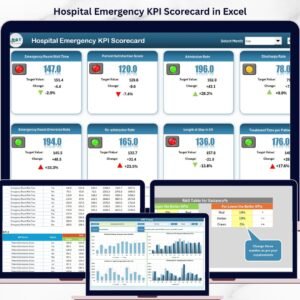
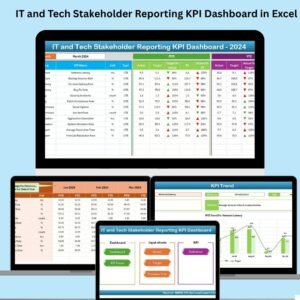
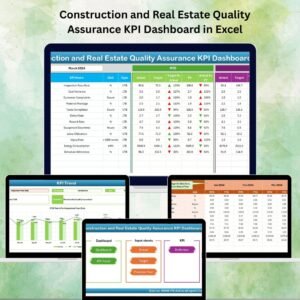
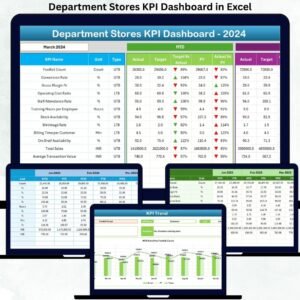
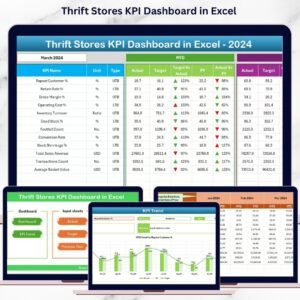
2️⃣ Dashboard Sheet: The main control center displaying MTD and YTD metrics, actual vs target comparisons, and visual KPI trends.
3️⃣ KPI Trend Sheet: Choose any KPI (Cell C3) to explore historical data and visualize trends through dynamic charts.
4️⃣ Actual Numbers Input Sheet: Record your monthly actual performance data — the foundation of your analysis.
5️⃣ Target Sheet: Define clear MTD and YTD targets for each KPI to measure progress effectively.
6️⃣ Previous Year Number Sheet: Store last year’s performance data for side-by-side comparisons.
7️⃣ KPI Definition Sheet: A reference library listing all KPI Names, Groups, Units, Formulas, and Definitions to ensure clarity and consistency.
Each worksheet is seamlessly interconnected to give you a fully automated reporting experience — all in Excel.
🧠 How to Use the Electronics Retail KPI Dashboard in Excel
⚙️ Step 1: Open the Excel file and go to the Actual Numbers Input Sheet to enter your MTD and YTD values.
🎯 Step 2: Define performance goals in the Target Sheet and update PY data in the Previous Year Sheet.
📊 Step 3: Select a month from the dropdown (Cell D3) on the Dashboard Sheet to view real-time KPI performance.
📈 Step 4: Analyze detailed trends in the KPI Trend Sheet to identify seasonal or category-level changes.
📘 Step 5: Update or edit definitions in the KPI Definition Sheet whenever new KPIs are added.
That’s it — your dashboard is now ready to give real-time, actionable insights!
👥 Who Can Benefit from This Electronics Retail KPI Dashboard
🛍️ Retail Business Owners: Track revenue, profitability, and category-level performance.
📦 Inventory Managers: Monitor stock levels, inventory turnover, and wastage rates.
📈 Sales Teams: Evaluate product performance and identify top-selling brands.
💼 Finance Professionals: Compare actual vs target profits and control costs.
🧑💻 Marketing Teams: Measure campaign effectiveness and customer conversion rates.
🏪 Store Managers: Get instant visibility on store-wise and monthly trends.
📊 Analysts: Build reports using consistent KPI data and definitions.
This Excel dashboard works perfectly for both single-store and multi-outlet retailers, ensuring transparency and growth-driven performance tracking.
🔗 Click here to read the Detailed Blog Post
🎥 Visit our YouTube channel to learn step-by-step video tutorials
👉 YouTube.com/@PKAnExcelExpert


Reviews
There are no reviews yet.