


Electricity purchasing is one of the largest and most sensitive cost components for organizations operating plants, utilities, data centers, infrastructure facilities, and large commercial sites. Electricity Purchasing Dashboard in Power BI Every unit of electricity involves base purchase cost, transmission charges, taxes, payment conditions, utility variations, and energy source differences. Therefore, relying on static spreadsheets or delayed reports often results in poor visibility, rising costs, and slow decision-making.
That is exactly why the Electricity Purchasing Dashboard in Power BI becomes a powerful and modern analytics solution.
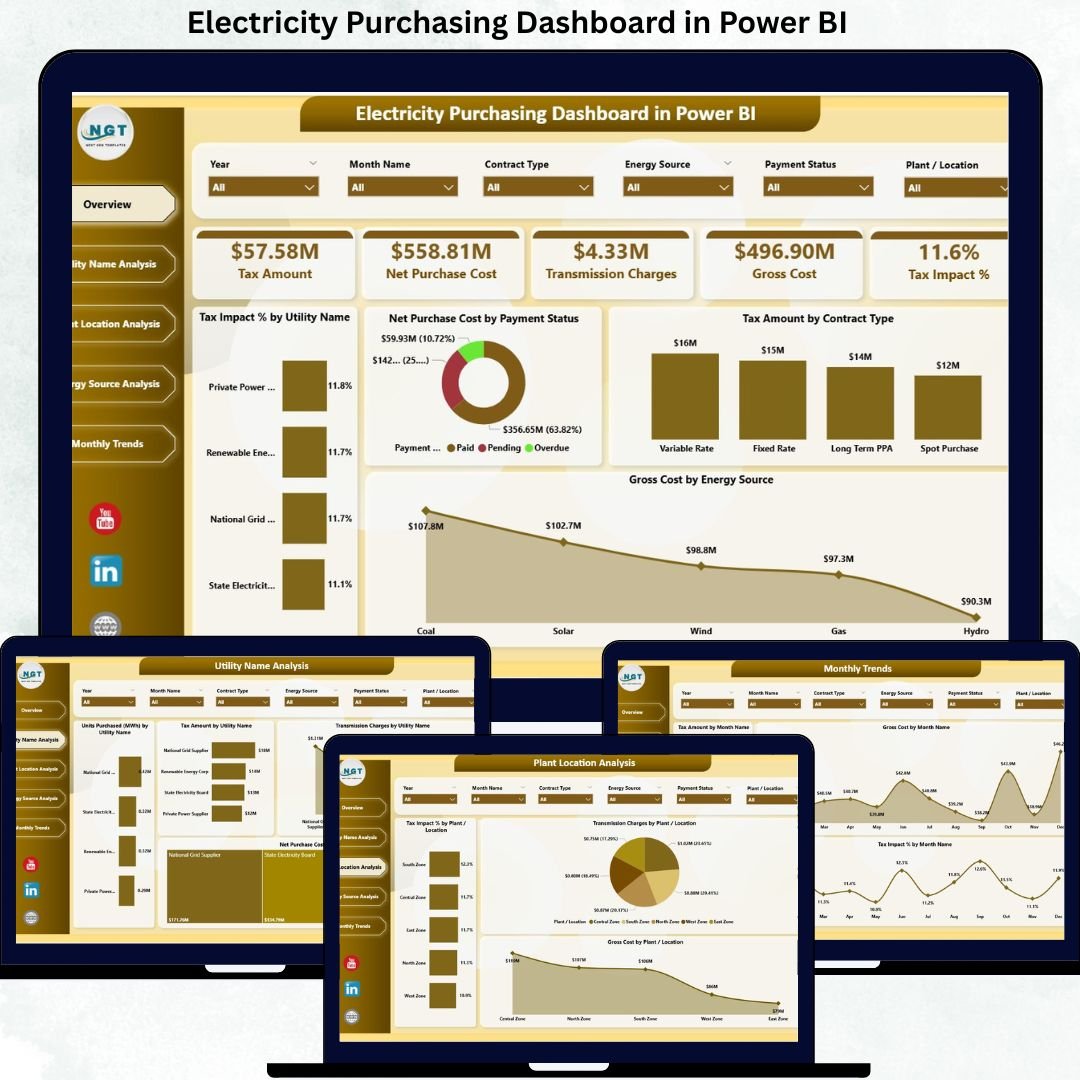
Electricity Purchasing Dashboard in Power BI This professionally designed Power BI dashboard transforms raw electricity purchasing data into interactive KPIs, dynamic visuals, and time-based trends. Instead of manually reviewing cost tables, decision-makers gain real-time visibility into gross cost, net purchase cost, tax impact, transmission charges, utility-wise performance, plant-wise variations, and renewable energy contribution—all in one centralized dashboard.
Because it is built on Microsoft Power BI, this dashboard delivers high performance, interactive filtering, scalability, and secure sharing, making it ideal for enterprise-level electricity cost management.
🔑 Key Features of Electricity Purchasing Dashboard in Power BI
⚡ Real-Time Electricity Cost Monitoring
Track electricity purchase cost dynamically with live Power BI visuals.
💰 Gross vs Net Cost Transparency
Instant visibility into gross cost, net purchase cost, transmission charges, and tax impact.
📊 Interactive KPI Cards
High-level KPIs update instantly with slicers and filters.
🏭 Utility & Plant-Wise Analysis
Identify high-cost utilities and expensive plant locations quickly.
🌱 Energy Source & Renewable Tracking
Monitor energy mix, renewable percentage, and tax impact by source.
📅 Monthly Trend Analysis
Understand seasonal cost patterns and tax fluctuations over time.
🎯 Advanced Filtering & Drilldowns
Slice data by utility, location, energy source, contract type, and month.
🔐 Scalable & Secure Power BI Platform
Handles large datasets with enterprise-grade security and sharing.
📦 What’s Inside the Electricity Purchasing Dashboard in Power BI
This ready-to-use dashboard includes five analytical pages, each designed to answer a specific electricity purchasing question.
📊 Overview Page – Overall Electricity Purchasing Performance

The Overview Page acts as the executive summary.
KPI Cards Display:
-
Tax Amount
-
Net Purchase Cost
-
Transmission Charges
-
Gross Cost
-
Tax Impact %
Charts Included:
-
Tax Impact % by Utility Name
-
Net Purchase Cost by Payment Status
-
Tax Amount by Contract Type
-
Gross Cost by Energy Source
This page delivers instant clarity on cost structure and financial impact.
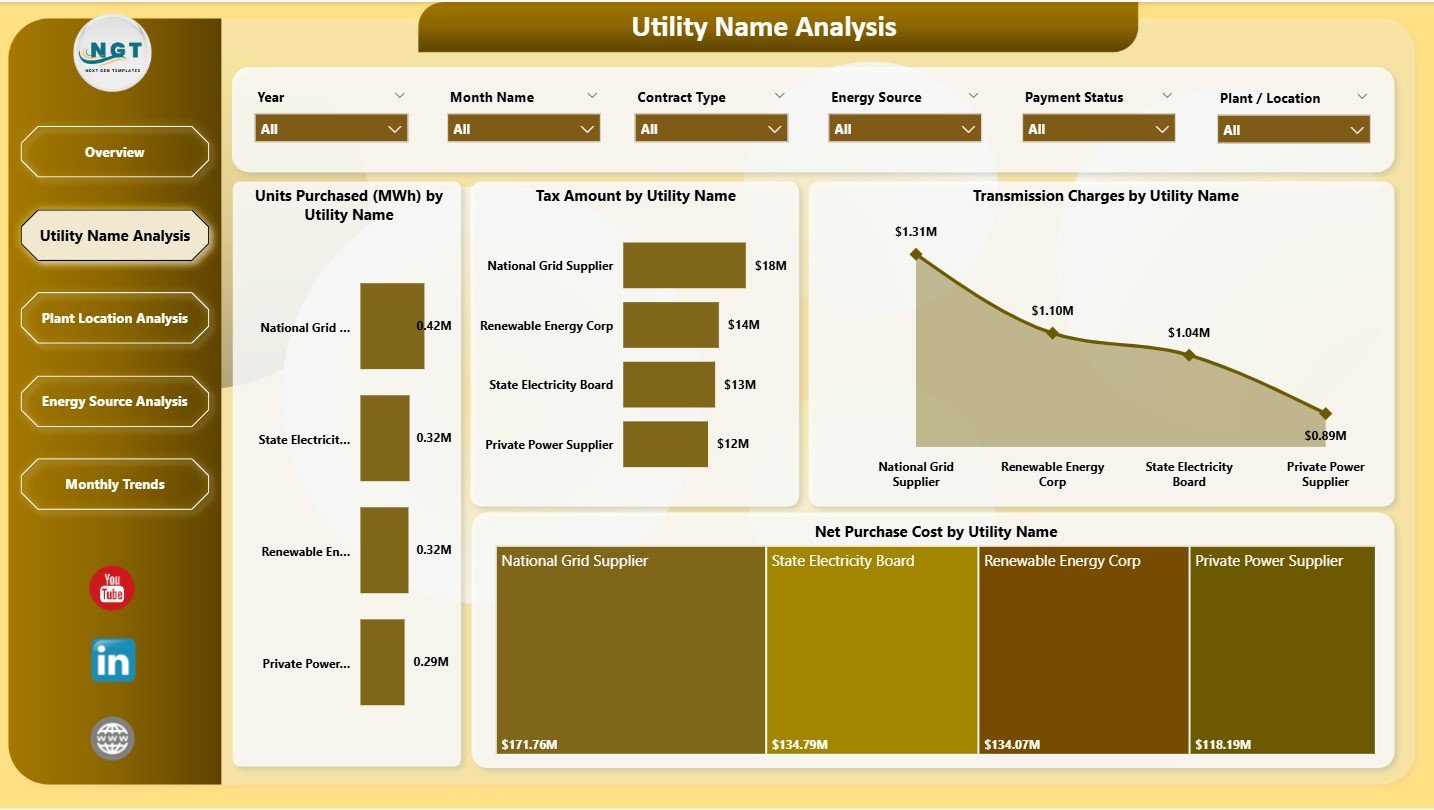
🏭 Utility Name Analysis – Which Utilities Drive Higher Costs?
This page compares electricity purchasing performance utility-wise.
Charts Included:
-
Units Purchased (MWh) by Utility Name
-
Tax Amount by Utility Name
-
Transmission Charges by Utility Name
-
Net Purchase Cost by Utility Name
Helps procurement teams evaluate utilities and negotiate better contracts.
🏗️ Plant Location Analysis – Where Are Electricity Costs Higher?
Electricity costs vary significantly by location.
Charts Included:
-
Tax Impact % by Plant / Location
-
Transmission Charges by Plant / Location
-
Gross Cost by Plant / Location
Supports targeted cost-reduction initiatives at high-cost facilities.
🌱 Energy Source Analysis – How Does Energy Mix Affect Cost?
This page focuses on cost and sustainability.
Charts Included:
-
Renewable % by Energy Source
-
Units Purchased (MWh) by Energy Source
-
Tax Amount by Energy Source
Ideal for ESG reporting and renewable energy planning.
📅 Monthly Trends – How Does Electricity Purchasing Change Over Time?
Time-based analysis reveals patterns that static reports miss.
Charts Included:
-
Tax Amount by Month
-
Gross Cost by Month
-
Tax Impact % by Month
Perfect for budgeting, forecasting, and seasonal planning.
▶️ How to Use the Electricity Purchasing Dashboard in Power BI
1️⃣ Load electricity purchasing data from Excel or database
2️⃣ Refresh Power BI dataset (manual or scheduled)
3️⃣ Review KPIs on the Overview Page
4️⃣ Analyze utilities, plants, and energy sources
5️⃣ Track tax and transmission impact
6️⃣ Monitor monthly trends
7️⃣ Share insights securely with stakeholders
No advanced Power BI skills required for end users.
🎯 Who Can Benefit from This Dashboard
⚡ Energy & Utility Managers
📦 Procurement & Purchasing Teams
💰 Finance & Accounting Departments
🌱 Sustainability & ESG Teams
🏭 Plant & Operations Managers
👔 Senior Management & Executives
Designed for organizations that need real-time electricity cost visibility and control.
👉 Click here to read the Detailed Blog Post
🔔 Visit our YouTube channel to learn step-by-step Power BI tutorials
👉 https://www.youtube.com/@PKAnExcelExpert


Reviews
There are no reviews yet.