In today’s energy-driven economy, success in electricity distribution depends on real-time insights, performance visibility, and operational efficiency. Managing thousands of data points manually is no longer practical — which is why the Electricity Distribution KPI Dashboard in Power BI is the ultimate solution for modern utility organizations.
This ready-to-use Power BI dashboard consolidates key performance indicators from your electricity distribution network into one intuitive, visual, and interactive platform. Built on Microsoft Power BI and powered by structured Excel data, it allows managers and engineers to analyze performance metrics like network efficiency, load distribution, downtime, losses, and service reliability — all in real time.
Designed for electricity boards, power grid operators, and energy management teams, this dashboard helps transform raw data into actionable intelligence — driving better operational decisions, improved reliability, and measurable cost savings.
⚙️ Key Features of the Electricity Distribution KPI Dashboard in Power BI
📊 3 Dynamic Dashboard Pages: Includes Summary, KPI Trend, and KPI Definition pages for a complete analytical view.
📅 Month-to-Date & Year-to-Date Analysis: Track current performance and compare it with past trends instantly.
📈 Interactive Slicers: Filter KPIs by month or category (e.g., reliability, energy losses, revenue) for focused insights.
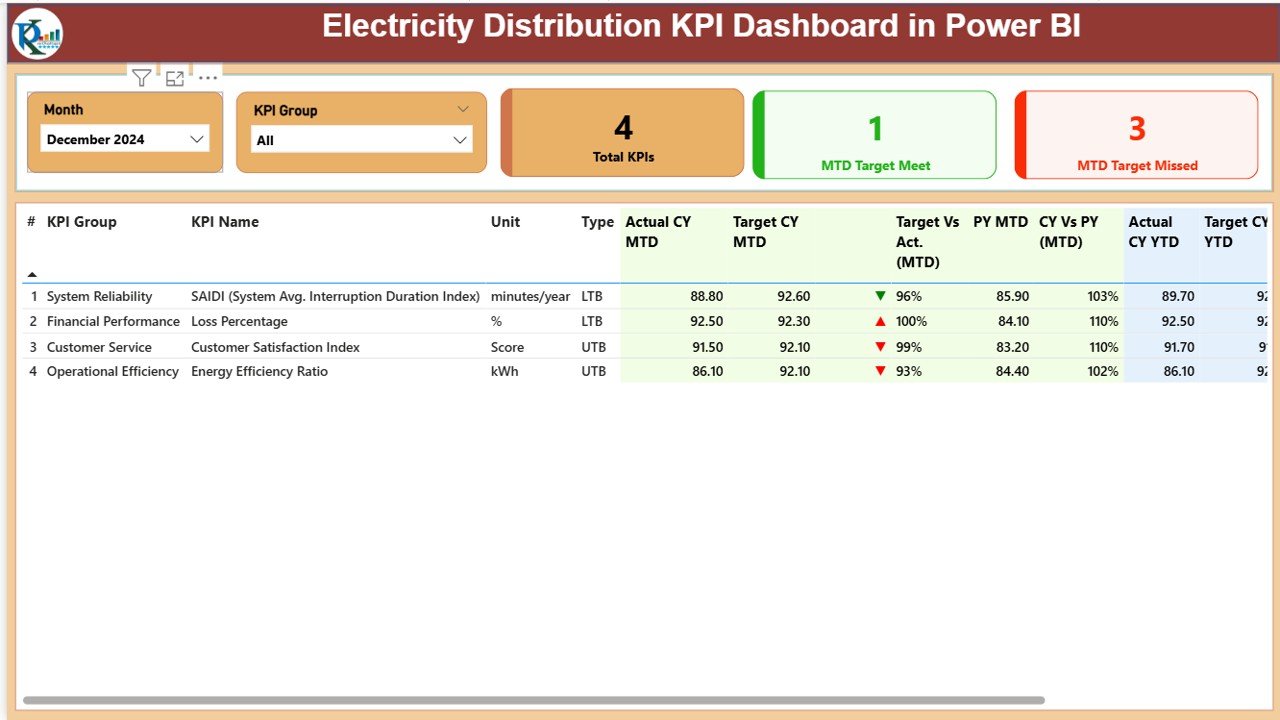
📇 KPI Cards & Color Indicators: Instantly identify target achievements and missed goals through conditional icons and visuals.
🔍 Drill-Through Functionality: Explore detailed KPI formulas, definitions, and types directly within the dashboard.
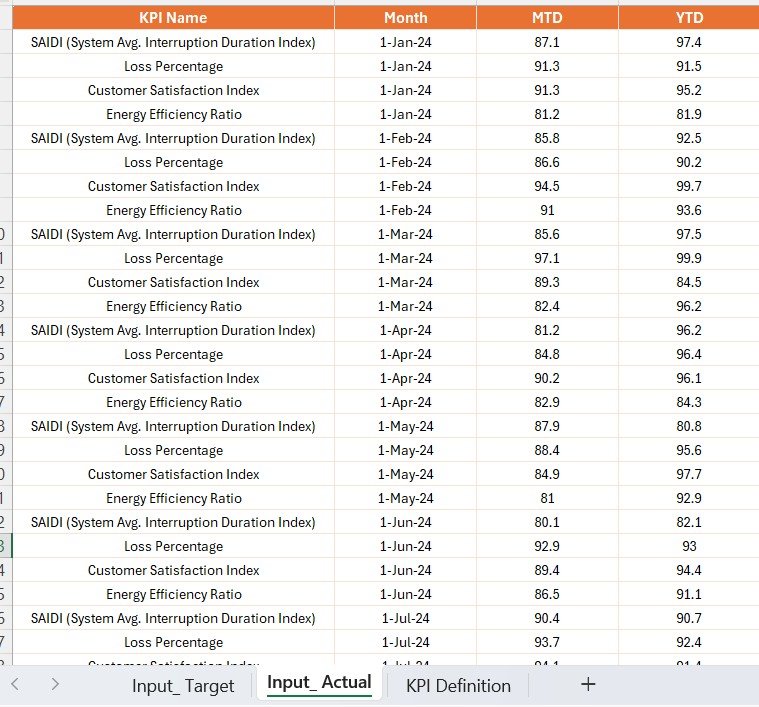
💾 Excel Data Integration: Seamlessly connect to your Excel input sheets — Input_Actual, Input_Target, and KPI Definition.
⚡ No Manual Reporting: Power BI automates updates and visualizations, eliminating spreadsheet dependency.
📉 Performance Trend Visualization: View Actual vs Target vs Previous Year data with interactive combo charts.
🔒 User-Friendly Navigation: Move easily between pages using navigation buttons and slicers.
🌎 Ideal for Energy Organizations: Perfect for electricity boards, power utilities, and energy management departments.
📘 What’s Inside the Electricity Distribution KPI Dashboard in Power BI
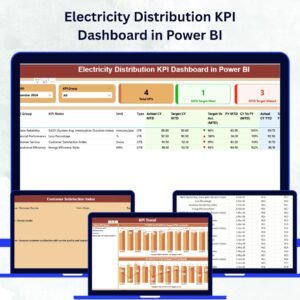
The dashboard includes three professionally designed pages:
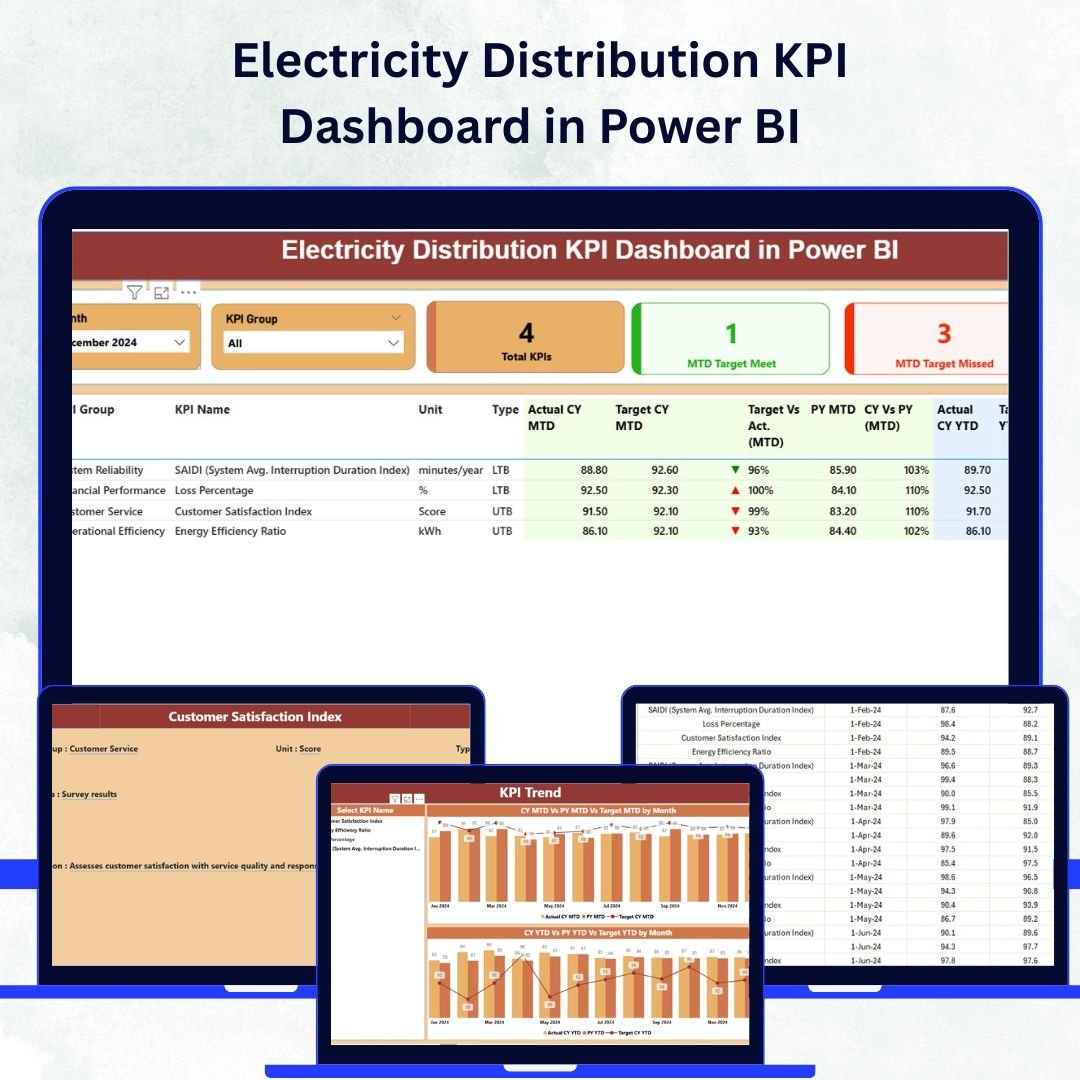
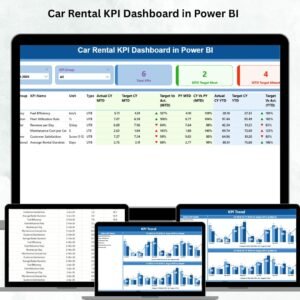
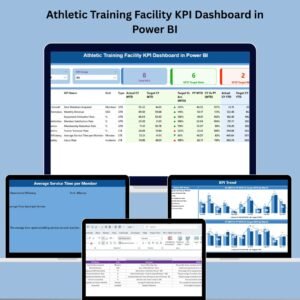
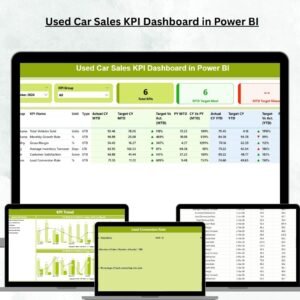
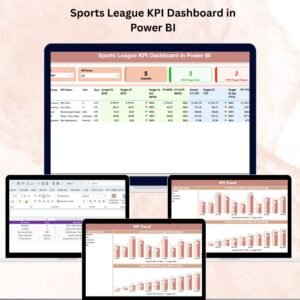
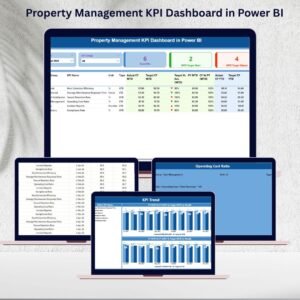
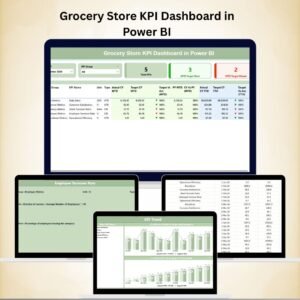
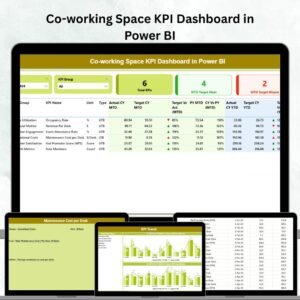
1️⃣ Summary Page: The main dashboard interface with KPI slicers, total KPI count, and performance cards for MTD and YTD results.
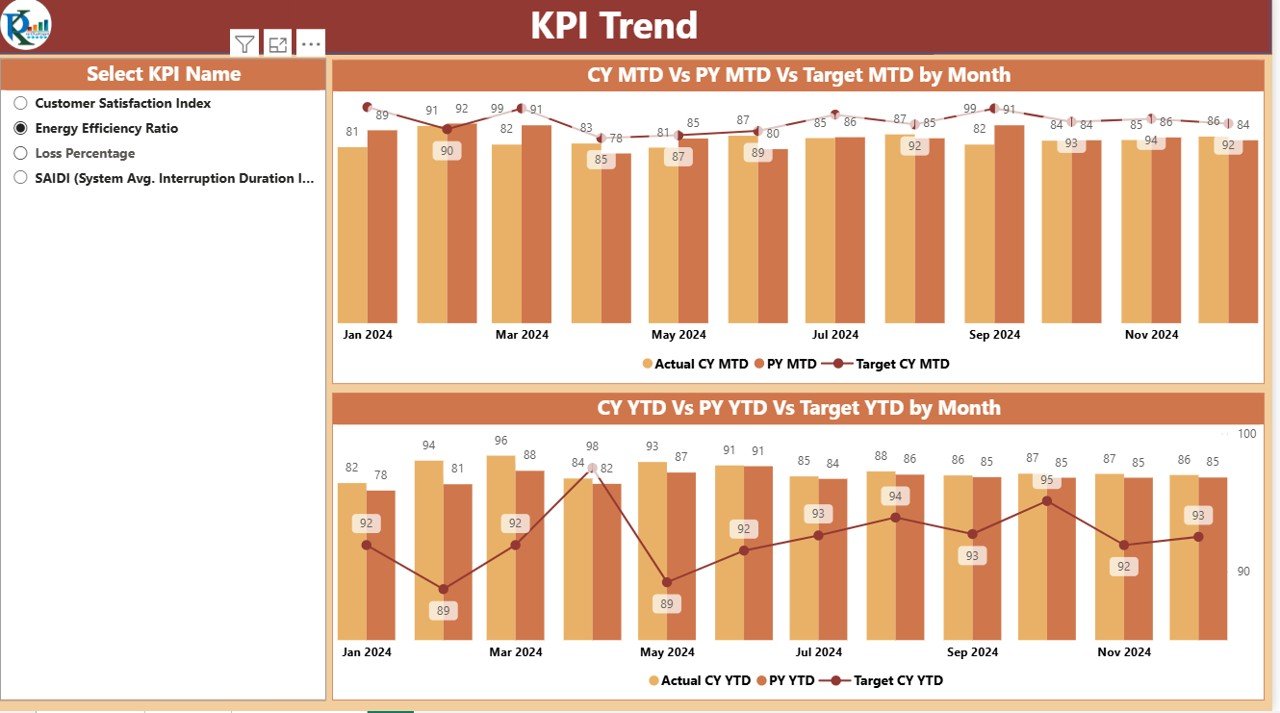
2️⃣ KPI Trend Page: Two interactive combo charts displaying Actual vs Target vs Previous Year (MTD and YTD) — helping teams analyze improvement or decline trends.
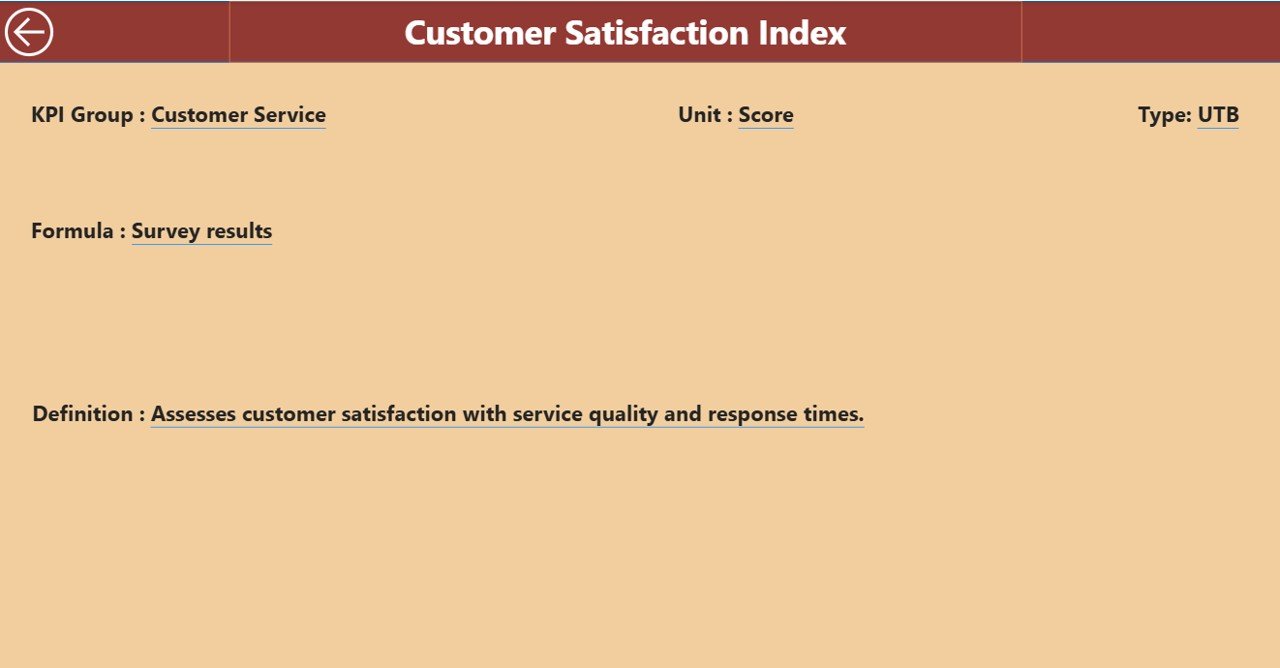
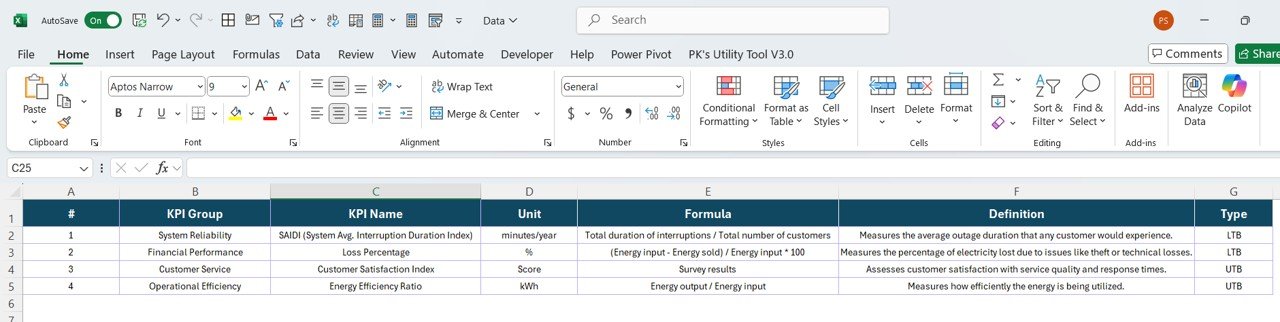
3️⃣ KPI Definition Page: A hidden drill-through sheet providing detailed KPI metadata such as formula, definition, and measurement type (LTB or UTB).
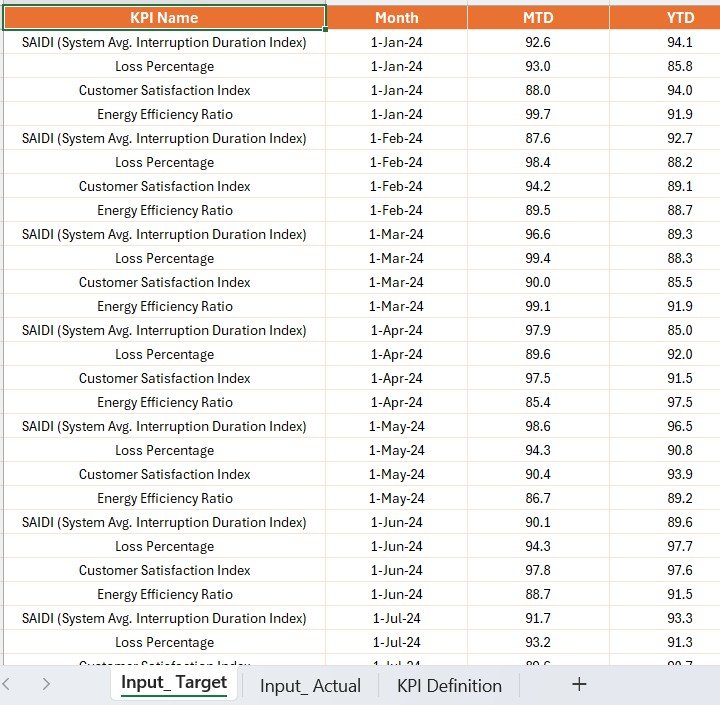
All visuals pull live data from three Excel sheets — Input_Actual, Input_Target, and KPI Definition — ensuring easy updates without Power BI expertise.
⚡ How to Use the Electricity Distribution KPI Dashboard in Power BI
⚙️ Step 1: Open the Power BI file on your desktop and connect it to your Excel data source.
📊 Step 2: Load data from Input_Actual, Input_Target, and KPI Definition sheets.
🔁 Step 3: Refresh the dashboard to see updated KPIs and visuals.
📅 Step 4: Use the Month and KPI Group slicers to analyze performance for specific areas.
🧭 Step 5: Drill through on any KPI to view its detailed definition and metrics.
Within minutes, you’ll gain a 360° operational overview — from transformer efficiency and outage duration to system reliability and revenue growth.
👥 Who Can Benefit from the Electricity Distribution KPI Dashboard in Power BI
⚡ Electricity Boards & Utilities: Track KPIs like power loss %, downtime, and efficiency in real time.
🏭 Energy Management Teams: Evaluate operational efficiency and identify areas for improvement.
📈 Finance Departments: Analyze revenue collection, cost per MWh, and profitability metrics.
🧠 Executives & Decision Makers: Gain instant insights into overall network performance and reliability.
🔧 Operations Engineers: Detect inefficiencies early and plan preventive maintenance.
🌍 Sustainability Teams: Monitor carbon reduction, renewable integration, and energy recovery rates.
This Power BI dashboard empowers every level of the organization — from ground engineers to top management — to make smarter, data-driven decisions.
🔗 Click here to read the Detailed Blog Post
🎥 Visit our YouTube channel to learn step-by-step video tutorials
🔗 YouTube.com/@PKAnExcelExpert


Reviews
There are no reviews yet.