

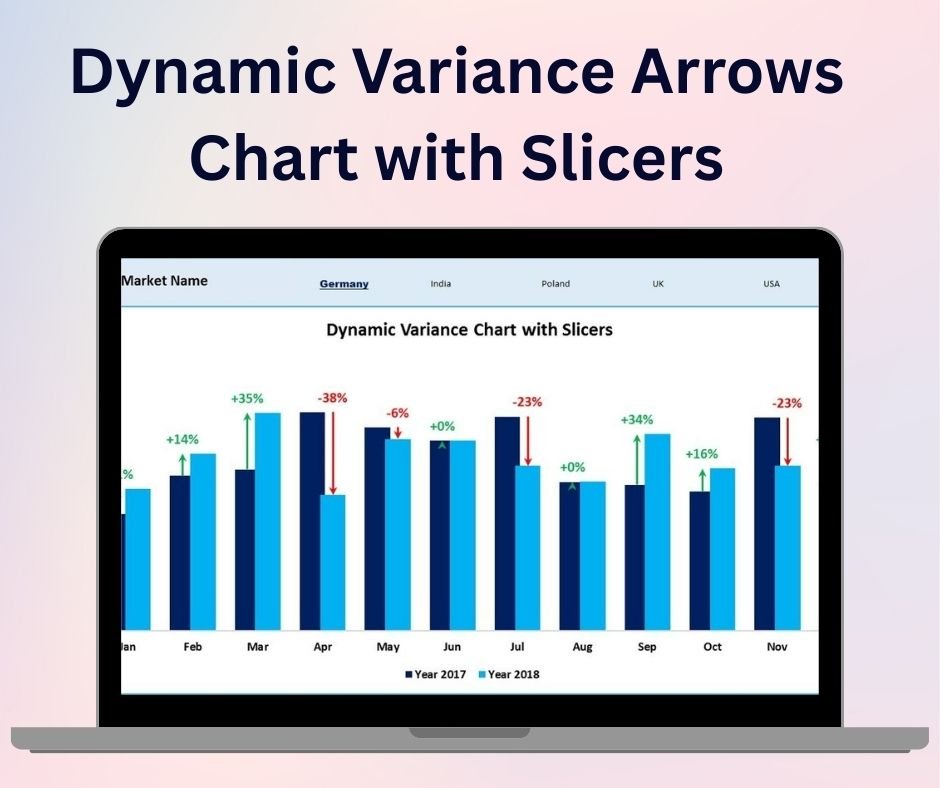

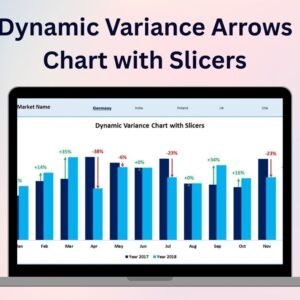
The Dynamic Variance Arrows Chart with Slicers is a sophisticated and visually appealing Excel tool designed to help you track performance variances in your business or project. This interactive chart provides a clear visual representation of positive and negative variances using dynamic arrows, and it includes slicers for easy data filtering. It’s perfect for financial analysts, business managers, and project leads who need to quickly assess and communicate key variances between actual and planned performance metrics.
This chart not only visualizes the variances in a visually engaging way but also allows you to drill down into specific data points using the slicers. By incorporating interactive elements such as slicers, the tool gives you the flexibility to adjust the view according to your needs, enabling you to track variances across multiple departments, projects, or time periods. Whether you’re comparing sales performance, budget versus actual expenses, or any other key metrics, the Dynamic Variance Arrows Chart helps you identify areas for improvement and make informed decisions.
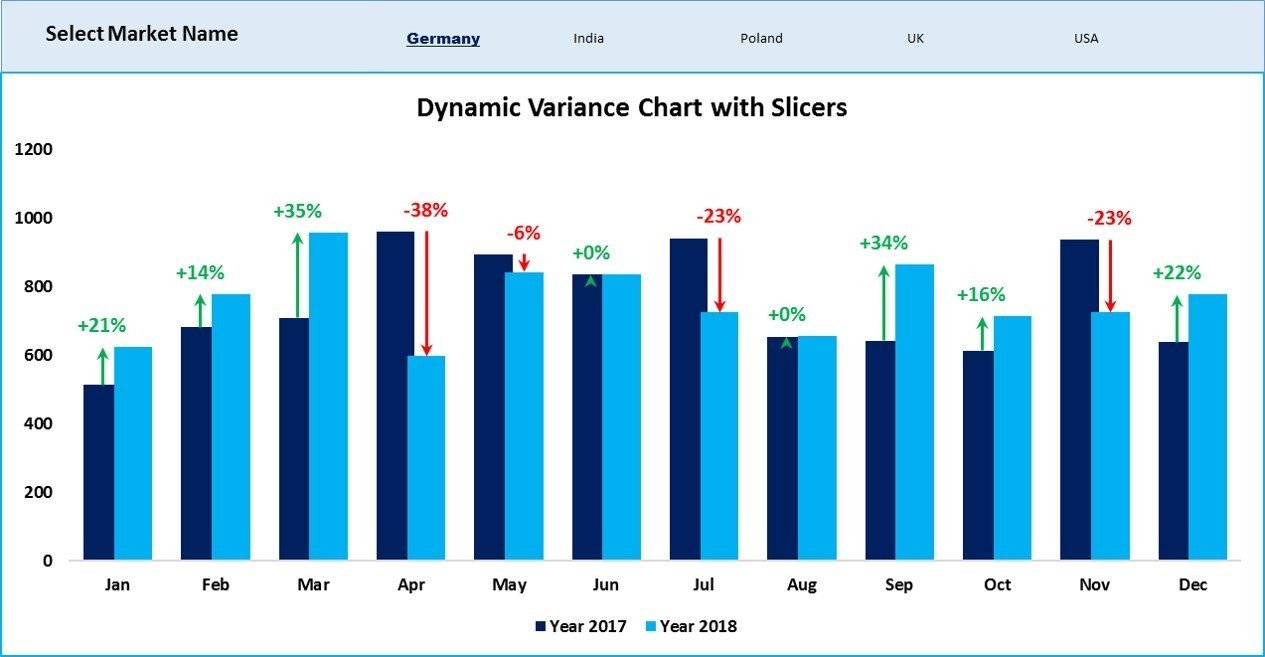
Key Features of the Dynamic Variance Arrows Chart with Slicers:
📊 Variance Representation with Arrows
Use dynamic arrows to represent both positive and negative variances, making it easy to understand performance at a glance.
🔄 Interactive Slicers
Incorporate slicers into your chart to filter data by department, time period, or other criteria, allowing you to drill down and analyze performance in specific areas.
📈 Real-Time Data Updates
The chart dynamically updates as you adjust data or apply slicers, providing real-time insights into your performance metrics and variances.
🎨 Customizable Design
Adjust the chart’s colors, labels, and slicer settings to suit your business needs and make the chart fit seamlessly into your reports or dashboards.
💡 Actionable Insights
Easily spot areas of concern or success by visualizing where performance is exceeding or falling short of expectations.
Why You’ll Love the Dynamic Variance Arrows Chart with Slicers:
✅ Clear and Immediate Visualization – The dynamic arrows quickly show whether performance is above or below target, helping you assess the situation at a glance. ✅ Data Filtering with Slicers – Filter and analyze your data with ease, focusing on specific departments, time periods, or other important criteria. ✅ Real-Time Insights – With slicers and dynamic updates, you can view the most current performance metrics and variances instantly. ✅ User-Friendly – This chart is easy to set up, customize, and use, with an intuitive interface that doesn’t require advanced Excel skills. ✅ Perfect for Presentations – Use this chart in business meetings or presentations to communicate performance variances effectively, helping stakeholders make informed decisions.
What’s Inside the Dynamic Variance Arrows Chart with Slicers:
- Dynamic Variance Arrows – Visualize positive and negative variances with clear, dynamic arrows.
- Interactive Slicers – Use slicers to filter and analyze data in specific areas or time periods.
- Real-Time Data Updates – Automatically adjust the chart as data is changed or filtered.
- Customizable Design – Adjust colors, labels, and slicers to match your business needs.
- Actionable Performance Insights – Quickly identify where performance is exceeding or falling short of expectations.
How to Use the Dynamic Variance Arrows Chart with Slicers:
1️⃣ Download the Template – Access the Excel file instantly after purchase. 2️⃣ Input Your Data – Add your actual and planned performance data into the chart. 3️⃣ Use the Slicers – Apply slicers to filter data by time period, department, or other criteria. 4️⃣ Track Variances – Review the arrows and slicers to assess performance and make data-driven decisions.
Who Can Benefit from the Dynamic Variance Arrows Chart with Slicers:
- Financial Analysts
- Business Managers
- Project Managers
- Operations Teams
- Sales Teams
- Data Analysts
- Anyone looking to track performance variances with ease
The Dynamic Variance Arrows Chart with Slicers is a powerful tool for anyone who needs to quickly and effectively analyze and communicate variances in their performance data. The interactive slicers and dynamic arrows provide both clarity and flexibility, making it easier to spot trends, identify issues, and make informed decisions.
Click here to read the Detailed blog post
https://www.pk-anexcelexpert.com/dynamic-variance-arrows-chart-with-slicers/
Visit our YouTube channel to learn step-by-step video tutorials
Watch the step-by-step video tutorial:
Compatibility and Requirements
- Works in Microsoft Excel desktop (Excel 2016 or later, or Microsoft 365).
- The chart is filtered with Excel slicers. Microsoft’s guide Use slicers to filter data shows how they work.
Frequently Asked Questions
What does the variance arrows chart show?
It compares actual and planned figures and draws an arrow for each variance, so positive and negative results are easy to tell apart.
What can I filter with the slicers?
The slicers filter the chart by department, time period or other criteria in your data, and the arrows update straight away.
What data do I need?
Your actual and planned performance figures. Enter them in the file and the chart calculates and plots the variance.
Can I change the colours and labels?
Yes. You can adjust the chart colours, labels and slicer settings to match your report or dashboard.
Related Chart Templates
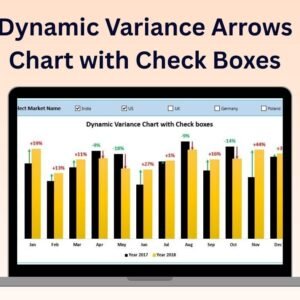
- Dynamic Variance Arrows Chart with Check Boxes: the same chart driven by check boxes
- Dynamic Sales Funnel Chart with Slicers: another slicer-driven chart
- Manufacturing Production Variance Analysis Dashboard in Excel: a full dashboard built around variance
- Data Analyst’s Chart & Visualization Pack: 10 chart templates in one pack
Browse all Excel chart templates or the Excel dashboards.








Reviews
There are no reviews yet.