

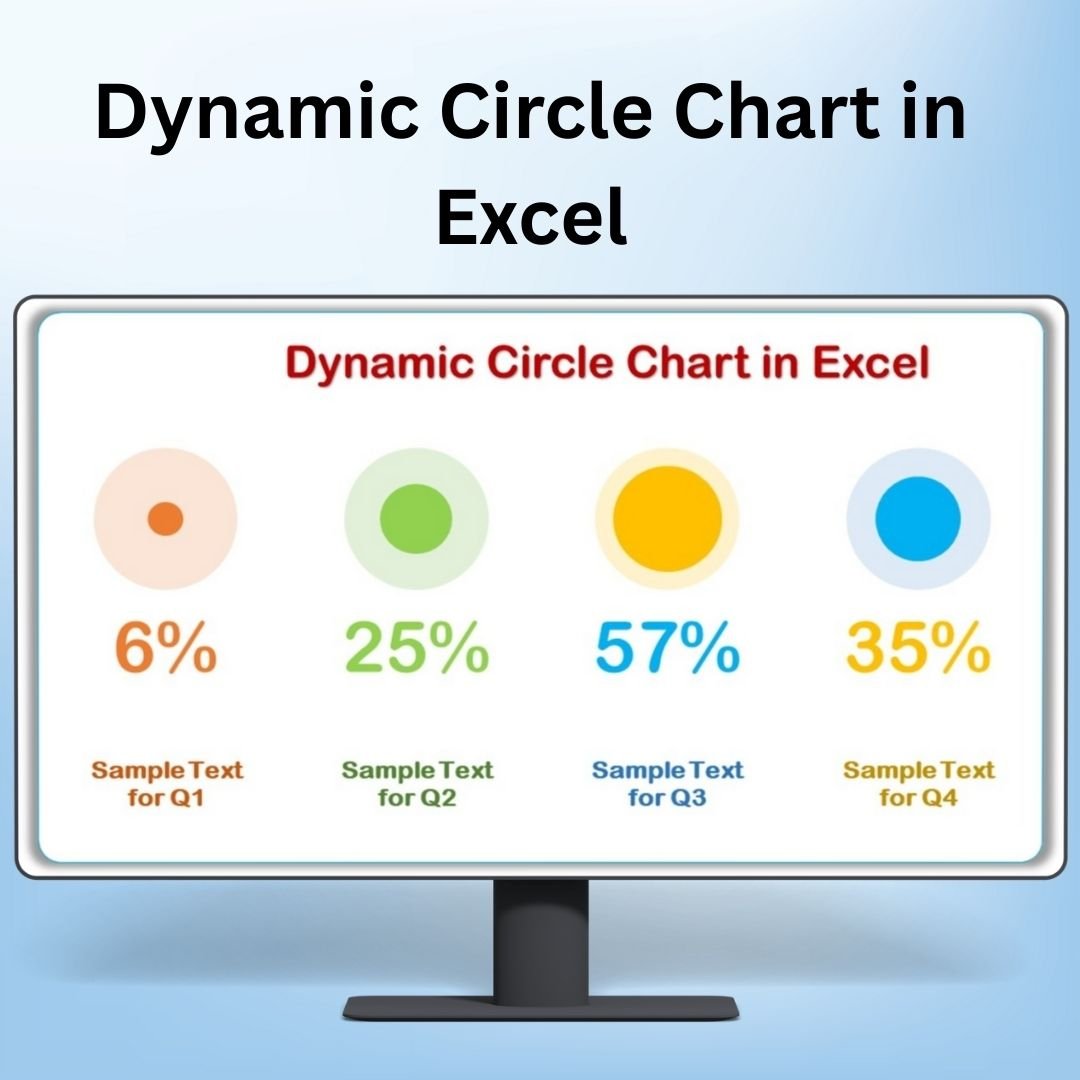

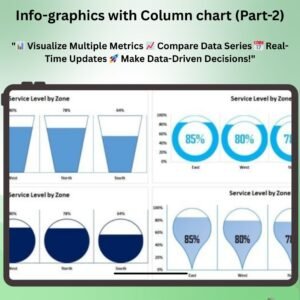
The Dynamic Circle Chart in Excel is an engaging and visually appealing way to present your data. Ideal for showcasing percentages, progress, or comparisons, this chart provides an intuitive and interactive method for visualizing key metrics. With its dynamic features, the Dynamic Circle Chart allows you to update and display real-time data, making it a perfect tool for dashboards, reports, and presentations.
This chart style stands out from traditional bar or pie charts by representing data in a circle, offering a sleek and professional design. The circular layout not only makes the chart visually appealing but also helps simplify complex data, making it easier for your audience to interpret. The Dynamic Circle Chart in Excel is fully customizable, allowing you to tailor it to your specific needs and enhance your data visualization.
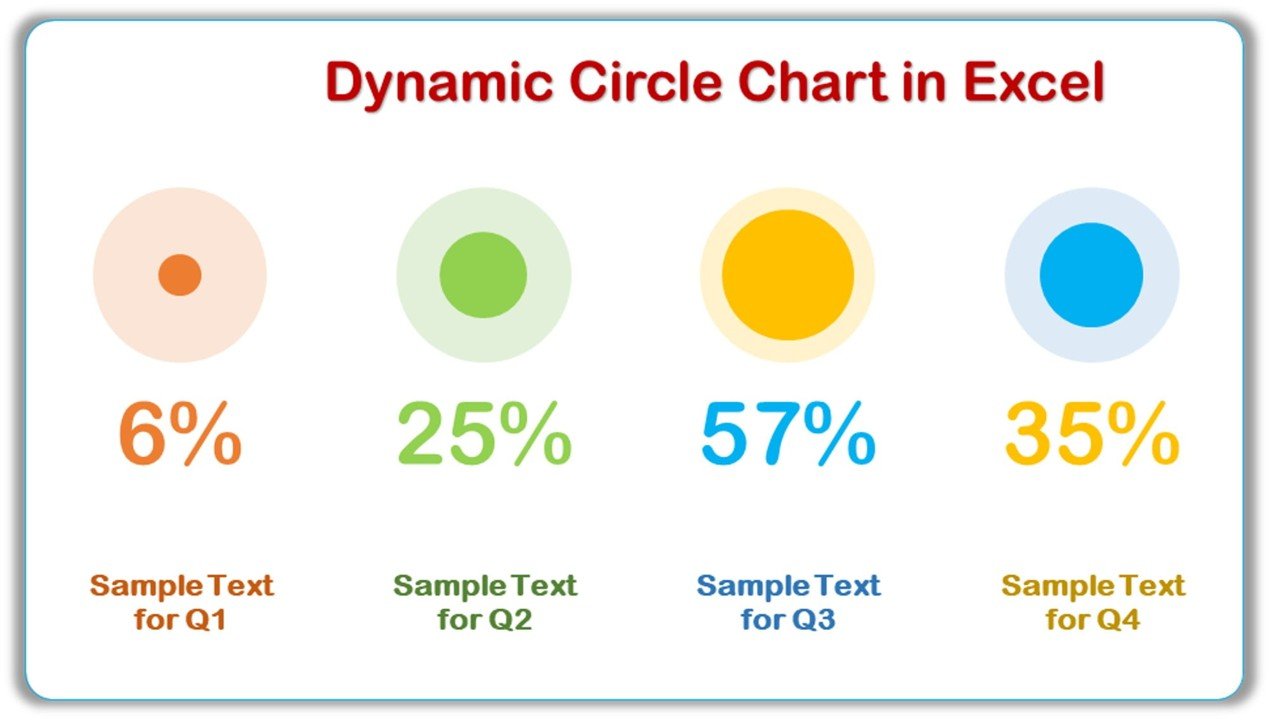
Key Features of the Dynamic Circle Chart in Excel
📌 Dynamic Design
The Dynamic Circle Chart automatically adjusts based on the data you enter, ensuring real-time updates as you modify the underlying values. This feature makes the chart ideal for tracking progress, performance, or other metrics that change over time.
🛠 Customizable Colors and Segments
You can easily customize the color scheme and the number of segments in the circle. Whether you’re visualizing one data point or multiple, the flexibility to adjust the chart’s appearance allows it to fit seamlessly into your brand style or presentation format.
💡 Visually Engaging Data Representation
Represent your data in a circle that is not only easy to understand but also visually engaging. The circular design allows you to show part-to-whole relationships or track progress, such as completion rates, with clarity and simplicity.
🔢 Percentage-Based Insights
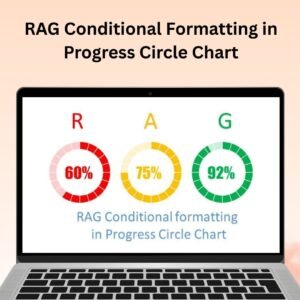
Perfect for illustrating percentage-based data, the Dynamic Circle Chart helps to highlight how much of a goal or target has been achieved. This visual representation makes it easier to track and communicate progress.
🚀 Real-Time Data Updates
As you update your data, the Dynamic Circle Chart automatically adjusts, reflecting the latest figures. This feature allows you to keep your presentations or dashboards up to date without the need for manual adjustments.
📊 Simple and Intuitive Setup
Setting up the Dynamic Circle Chart in Excel is quick and easy, even for beginners. With clear instructions and a straightforward design, you can have your chart ready in no time and start visualizing your data.
⚙ Interactive Data Exploration
The chart is interactive, meaning you can click on individual segments to explore specific data points. This interactivity allows for deeper insights and better understanding of how each part of your data contributes to the whole.
🚀 Why You’ll Love the Dynamic Circle Chart in Excel
✅ Dynamic Updates – Automatically adjusts as you update your data. ✅ Customizable Design – Adjust colors, segments, and more to fit your needs. ✅ Visually Appealing – A sleek circular design that is easy to understand. ✅ Real-Time Data – Instantly reflect changes in your data without manual adjustments. ✅ Ideal for Presentations – Perfect for showing progress, goals, or performance metrics.
📂 What’s Inside the Dynamic Circle Chart in Excel?
- Dynamic Circle Chart: A circle-based chart that dynamically updates as you modify data.
- Customizable Colors and Layout: Change the colors and adjust segments to match your data and style.
- Real-Time Data Updates: The chart updates automatically as new data is entered.
- Clear Setup Instructions: Simple, easy-to-follow instructions for quick implementation.
🔍 How to Use the Dynamic Circle Chart in Excel
1️⃣ Download the Template – Instant access to the Excel file upon purchase. 2️⃣ Input Your Data – Enter your percentage-based data into the template. 3️⃣ Customize the Chart – Adjust colors, segments, and labels to suit your needs. 4️⃣ Track and Present – Use the chart to track progress or illustrate part-to-whole relationships. 5️⃣ Share and Analyze – Share the chart in presentations or reports to showcase key insights.
🎯 Who Can Benefit from the Dynamic Circle Chart in Excel? 🔹 Project Managers
🔹 Marketing Teams
🔹 Business Analysts
🔹 Data Scientists
🔹 HR Managers
🔹 Anyone looking to visualize progress or compare percentages effectively
Enhance your presentations and reports with the Dynamic Circle Chart in Excel. This tool offers a sleek, interactive way to visualize your data and present it in a visually appealing manner.
Click here to read the Detailed blog post
https://www.pk-anexcelexpert.com/dynamic-circle-chart-in-excel/
Visit our YouTube channel to learn step-by-step video tutorials
Watch the step-by-step video tutorial:
Compatibility and Requirements
- Works in Microsoft Excel desktop (Excel 2016 or later, or Microsoft 365).
- The charts are standard Excel charts. Microsoft’s guide to creating a chart explains how to edit them.
Frequently Asked Questions
What kind of data suits the Dynamic Circle Chart?
Percentage-based data: progress toward a goal, completion rates or part-to-whole splits.
Can I change the colors and the number of segments?
Yes. You can change the color scheme, the number of segments and the labels.
Does the chart update when my numbers change?
Yes. It redraws automatically when you update the values, so there is nothing to adjust by hand.
Is it hard to set up?
No. The template comes with clear setup steps and works for Excel beginners.
Related Chart Templates
- Group of Circle Charts in Excel: several circle charts in one view.
- Half Circle KPI Charts in Excel using Doughnut Charts: half-circle KPI gauges.
- Ring Chart in Excel: a ring-style percentage chart.
- Animated Progress Circle Chart: a circle that animates as it fills.
- Data Analyst’s Chart & Visualization Pack: 10 chart templates for Excel and Google Sheets in one bundle.
Browse all Excel chart and visualization templates or the Excel dashboards.







Reviews
There are no reviews yet.